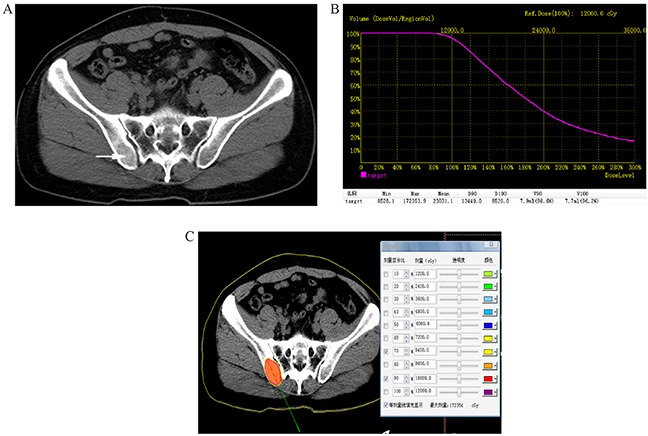
Figure 1.

A. Preoperative computed tomography (CT) image was obtained for targeting bone areas of interest, which showed one lesion in right iliac bone (arrowhead). B. Dose volume histograms (DVH). The prescription dose is 120 Gy during the planning. A total of 90% of the tumor target (D90) received 134.4 Gy, and 96.2% of the tumor received 100% of the prescribed dose (V100 = 96.2%). C. Isodose curves plotted by the treatment planning system (TPS), the planning target volume (PTV) edge was covered by isodose curve from 70% to 90%.
