
Figure 2. Genomic changes in smokers and never-smokers.
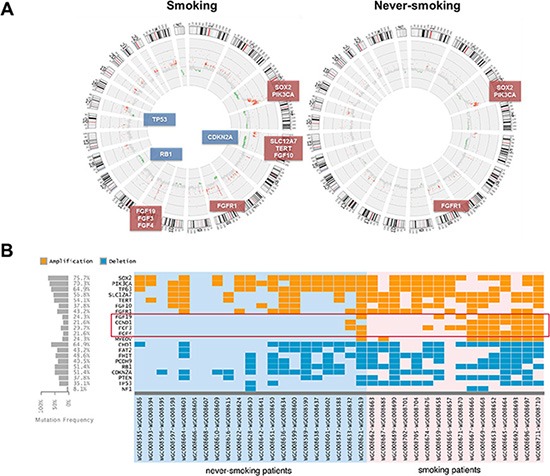
(A) Statistically recurrent peaks of gene amplification and deletion were shown in Circos graphs. (B) A heat map of significant different genetic events in 37 LSCC patients is provided for recurrently altered genes between two cohorts in our study. Copy number gains and deletions are color coded according to the legend provided. Each column denotes an individual normal/tumor paired patients, and each row represents a gene.