
Figure 3. Evaluation of FGF19 as a potential driver gene in LSCC.
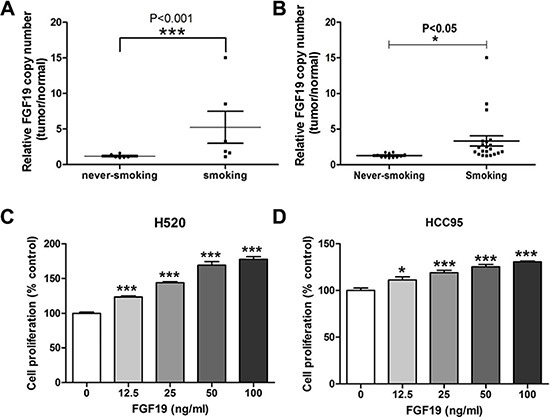
(A) Quantitative RT-PCR analysis of FGF19 gene copy number in samples from SQS and SQNS patients. FGF19 expression in tumor sample was normalized to the paired non-tumor samples and data from never-smoking and smoking groups were analyzed (one-way ANOVA, ***p < 0.001). (B) Additional validation samples of SQS and SQNS patients were similarly analyzed (one-way ANOVA, *p < 0.05). (C–D) Cell proliferation assay of LSCC cell lines H520 and HCC95 after FGF19 treatment for 48 h. (one-way ANOVA, *< 0.05, ***p < 0.001).