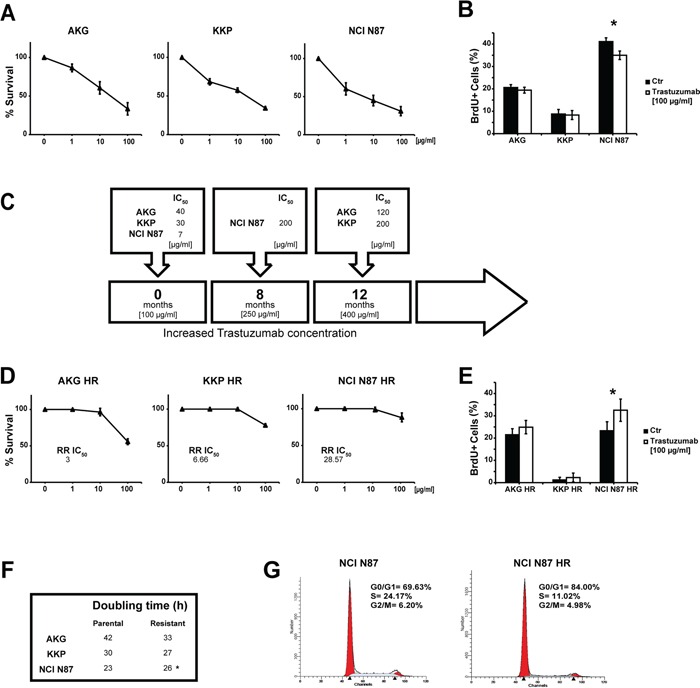
Figure 2. Induction of trastuzumab-resistance in gastric cancer cell lines.

A. Trastuzumab sensitivity curves in parental cell lines evaluated by clonogenic assay. Each point indicates the mean of at least three experiments. The standard deviation never exceeded 5%. B. Percentage (median value) of BrdU-positive cells after trastuzumab treatment (100 μg/ml). Values are the mean ± SD of three independent experiments. * significance at p<0.05 by t-test. C. The induction timeline of trastuzumab resistance. Resistant cells were generated by continuous treatment with trastuzumab for more than 8 months. D. Trastuzumab sensitivity curves in resistant cell lines evaluated by clonogenic assay. Each point indicates the mean of at least three experiments. Standard deviation never exceeded 5%. E. Percentage (median value) of BrdU-positive cells after trastuzumab treatment (100 μg/ml). Values are the mean ± SD of three independent experiments. * significance at p<0.05 by t-test. F. Doubling times of parental and resistant cell lines. G. Cell cycle analysis of NCI N87 and NCI N87 HR by flow cytometry. Data are expressed as a percentage of distribution in each cell-cycle phase.
