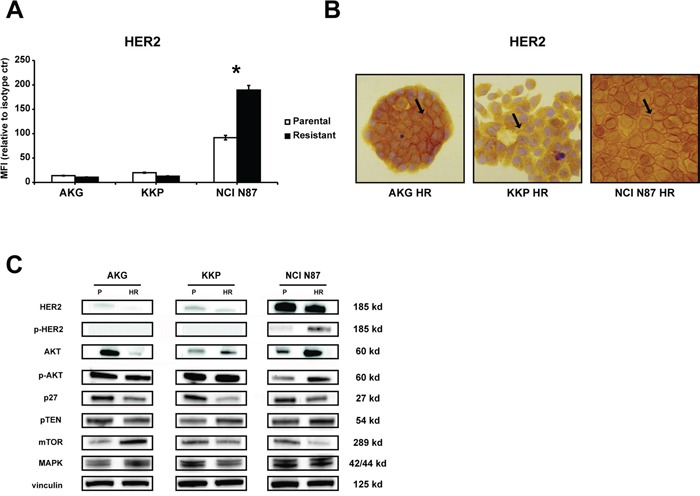
Figure 3. Characterization of trastuzumab targeting in resistant subclones: AKG HR, KKP HR and NCI N87 HR cells.

A. HER2 protein levels on the cell surface were quantified by flow cytometry and expressed as mean fluorescence intensity (MFI) relative to isotype control. Statistical significance was denoted as * p<0.05. B. HER2 staining by IHC in gastric cancer cell lines. Sample reactivity was evaluated by light microscopy (× 200 magnification) by two independent observers. Marker positivity was evaluated in a semiquantitative manner, as described in the Materials and Methods section. C. Western blotting showed HER2, p-HER2, AKT, p-AKT, p27, PTEN, mTOR and MAPK protein expression in parental (P) and resistant (HR) cell lines. Vinculin expression indicated equal loading. All gels were run under the same experimental conditions and the experiments were repeated 3 times. The representative images were cropped and shown.
