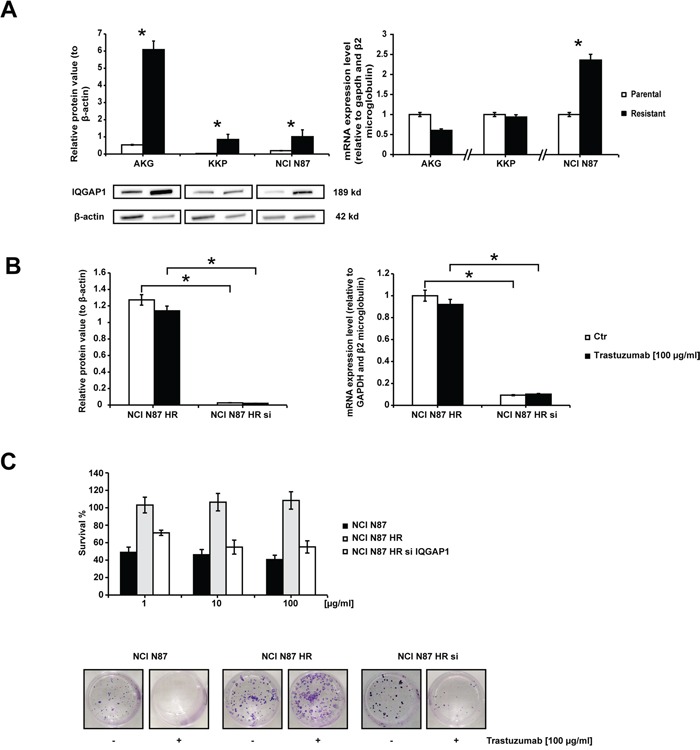
Figure 4. Trastuzumab sensitivity in subclone NCI N87 HR restored by IQGAP1 knockdown.

A. IQGAP1 expression. The left panel shows the western blot of IQGAP1 in gastric cancer cell lines. β-actin expression indicated equal loading. Densitometric quantification of total IQGAP1 was calculated using Quantity One Software. All gels were run under the same experimental conditions and the experiments were repeated 3 times. The representative images were cropped and shown. The right graph shows IQGAP1 mRNA expression levels in resistant cells quantified with respect to parental cells and normalized to GAPDH and β2 microglobulin. Data are presented as mean +- SD. * p<0.05. B. IQGAP1 silencing. IQGAP1 protein expression levels (left graph) and IQGAP1 mRNA levels (right graph) in NCI N87 HR and NCI N87 HR IQGAP1-silenced before and after a 72 h-exposure to 100 μg/ml of trastuzumab. Western blot analysis of IQGAP1 was normalized to β-actin. IQGAP1 mRNA levels were measured by Real Time PCR and normalized to GAPDH and β2 microglobulin. Values are the mean ± SD of three independent experiments. C. The effect of IQGAP1 knockdown in NCI N87 HR cells was investigated in colony formation experiments carried out 72 h after transfection. The upper panel illustrates relative growth curves (means +- SD) and the bottom panel shows representative colony photos.
