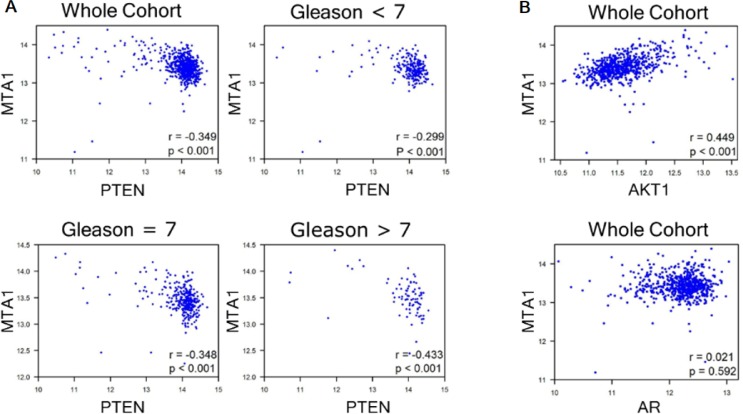
Figure 3. GEO analyses for correlation of MTA1 with PTEN, AKT1 and AR.
GSE41967 study of human prostate tissues (n = 639) [38] was used. Scatter plot depicting (A) strong negative correlation between MTA1 and PTEN (r = −0.349, whole cohort), which becomes stronger with increased Gleason score (r = −0.299, Gleason < 7; r = −0.348, Gleason = 7; r = −0.433, Gleason > 7, p < 0.001); (B) positive MTA1 correlation with AKT1 expression (r = 0.499, whole cohort, p < 0.001); and no correlation between MTA1 and AR (r = 0.021, whole cohort. p = 0.592). p values were calculated using two-tailed one-sample z-test for a correlation coefficient.

