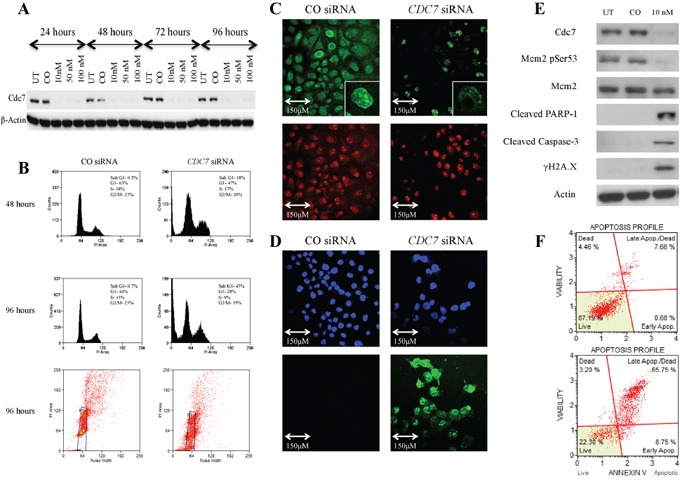
Figure 3. Knockdown of CDC7 mRNA in PANC-1 pancreatic adenocarcinoma cells following transfection with custom siRNA.

A. Western blot showing Cdc7 protein expression levels following transfection with different concentrations of CDC7 siRNA (10, 50 and 100 nM) along with untreated (UT) and non-coding siRNA (CO). There was evidence of reduced protein expression at each concentration and at each time point. β-Actin loading control is shown below. B. Flow cytometry showing that at 48 hours, there was no enrichment of PANC-1 cells in the G1 population following treatment with 10 nM CDC7 siRNA, and cells started to accumulate in a sub G1 peak. At 96 hours this effect was more pronounced with evident cell death, as represented by the sub G1 peak of 45% and plot of distribution including examples of gating. C. BrdU staining (green) in cells treated with 10 nM CDC7 siRNA and CO siRNA. A much smaller proportion of the CDC7 siRNA cells stained positive, indicating reduced synthesis of new DNA. PI staining (red) is shown as a control. D. There was avid TUNEL staining (green) of 10 nM CDC7 siRNA treated cells indicating apoptosis. DAPI staining (blue) is shown as a control. E. Western blot showing protein levels at 96 hours following Cdc7 depletion with 10 nM siRNA in the PANC-1 pancreatic adenocarcinoma cell line. There was reduced expression of Cdc7 protein and also loss of Cdc7 target phosphorylation of Mcm2 at Ser53. There was evidence of activation of the classical apoptotic pathway with cleavage of PARP-1 and Caspase-3. Phosphorylated γH2A.X was seen after Cdc7 depletion suggesting double strand DNA breaks. F. Annexin V staining confirmed apoptosis (early and late) in 8% of CO siRNA treated cells (upper graph), compared with 75% of the 10 nM CDC7 siRNA treated cells (lower graph).
