
Figure 6. Effect of treatment with PHA-767491 on Capan-1, PANC-1 and IMR90 cell lines.
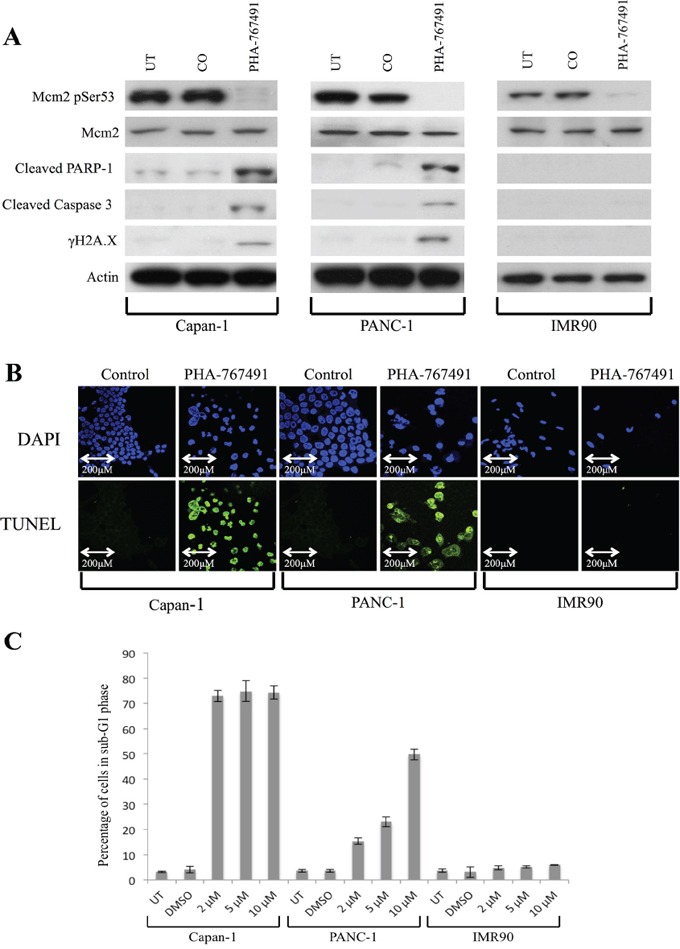
A. Western blot showing protein levels at 96 hours following Cdc7/Cdk9 inhibition in each cell line. There was loss of Cdc7 target phosphorylation of Mcm2 at Ser53 in all lines. There was evidence of activation of the classical apoptotic pathway with cleavage of PARP-1 and Caspase-3 in the pancreatic cancer lines, but not in IMR90. Furthermore, in the cancer lines, phosphorylated γH2A.X was seen after treatment with the inhibitor suggesting double strand breaks in DNA, but not in IMR90. β-Actin loading control is shown below for each cell line. B. TUNEL staining (green) was strongly positive in the Capan-1 (2 μM PHA-767491) and PANC-1 (10 μM PHA-767491) cells but absent in the IMR90 treated cells (2 μM PHA-767491). DAPI staining (blue) is shown as a control. C. The proportion of cells in sub-G1 phase after 96 hours is shown on a bar chart for each cell line. Capan-1 shows high levels of sub-G1 accumulation at all dosages but in the PANC-1 line, there appeared to be a clear dose-dependent increase in the percentage of cells accumulating in the sub G1 peak (2 μM-15%, 5 μM- 22%, 10 μM- 49%) versus the DMSO and untreated controls.