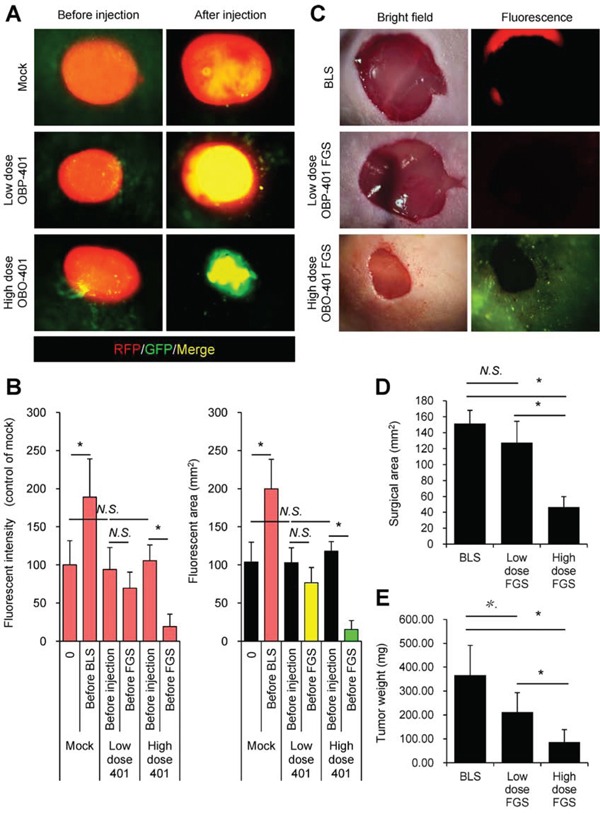
Figure 6. OBP-401 enables minimal precise surgery for orthotopic melanoma.

A. Representative whole-tumor images of orthotopic malignant melanoma before and after mock-infection or before and after i.t. administration of low-dose OBP-401 (1×10⁸ PFU) or high-dose OBP-401 (at 3×10⁸ PFU). B. Bar graphs show the fluorescence intensity of a control tumor and low-dose or high-dose OBP-401-targeted tumors (left). Fluorescent area is calculated with ImageJ software. Bar graphs show the fluorescence area of control tumor and low-dose or high-dose OBP-401-targeted tumors (right). Fluorescence intensity is calculated with ImageJ software. Data are shown as average ± SD. N = 10. C. Representative images of surgical area after BLS (upper) and low-dose (middle) or high-dose OBP-401-FGS (lower). Bright field images (left panels) and fluorescence images (right panels). D. Bar graphs show the comparison of surgical area after BLS, low-dose FGS, or high doe FGS. E. Bar graphs show the comparison of tumor weight after BLS, low-dose FGS, or high-dose FGS. Data are shown as average ± SD. N=10, *p<0.05.
