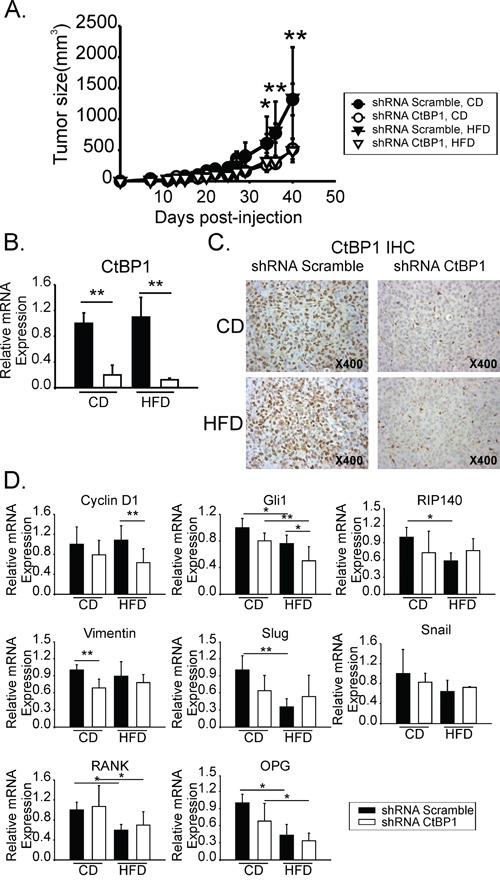
Figure 4. CtBP1 increased breast tumor growth in mice with MeS.

A. Tumor growth from CD or HFD orthotopic xenografts inoculated with shRNA scramble or shRNA CtBP1 cell lines. Curves indicate media and SD values of one representative experiment with 6 mice. B. CtBP1 RT-qPCR from HFD or CD xenograft samples. Data were normalized to β-actin and control. C. CtBP1 IHC from tumor xenografts. Magnification x400. D. RT-qPCR from xenograft tumors described above. Specific primers for the indicated genes were used. Data were normalized to β-actin and control. (*, p < 0.05; **, p < 0.01).
