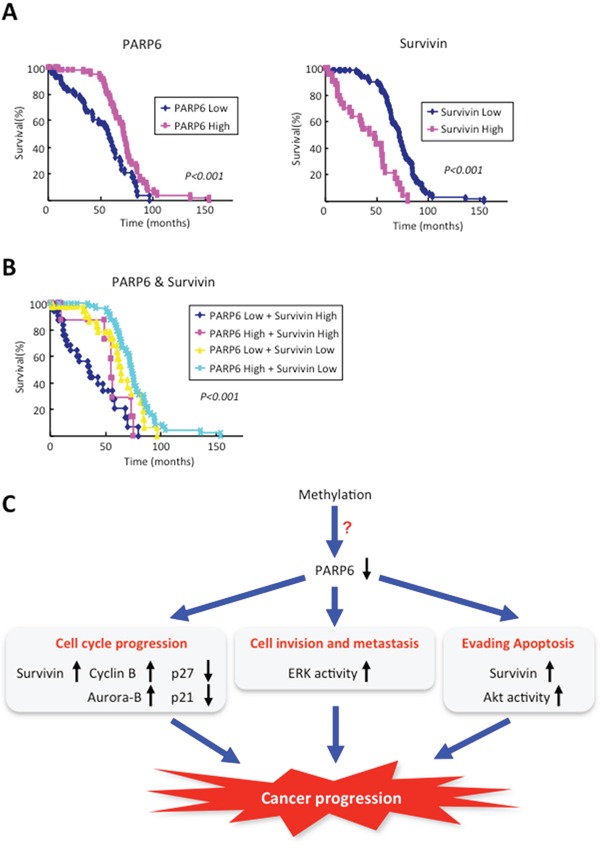
Figure 5. The prognostic value of PAPR6 and Survivin in CRC cases.

Kaplan–Meier curves with a univariate analysis (log-rank) for colorectal cancer according to the expression of PAPR6 and Survivin. A. Left graph shows Kaplan–Meier curves for colorectal cancer according to the expression of PAPR6. The prognosis for patients with high PAPR6 expression (n=66) was better than the prognosis for patients with low PAPR6 expression (n=79) (P<0.001). Right graph shows Kaplan–Meier curves for colorectal cancer according to the expression of Survivin. The prognosis for patients with high Survivin expression (n=49) was poorer than the prognosis for patients with low Survivin expression (n=96) (P<0.001). B. The survival analysis of the simultaneous expression of PARP6 and Survivin. The prognosis for patients with both high PARP6 expression and low Survivin expression is the best (n=54), and the patients with the worst prognosis exhibited both low PARP6 expression and high Survivin expression (n=37). The prognoses of the other two groups were in the middle (n=54) (P<0.001). C. Schematic model of the role of PARP6 in CRC progression.
