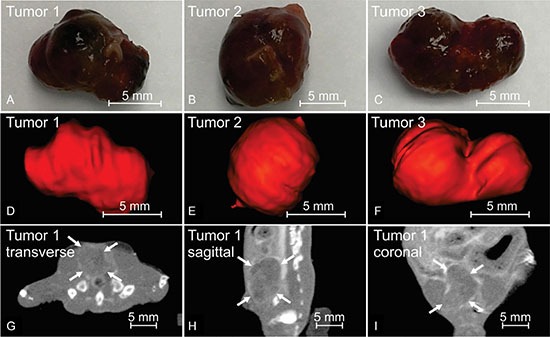
Figure 4. Contrast enhanced CBCT of orthotopically grown LNCaP prostate tumors.

Panel (A–C) show the LNCaP prostate tumors excised immediately after the animal was euthanized, with dark red color indicating rich vasculature. (D–F) are the three-dimensional rendering of corresponding tumors contoured from CBCT scanned immediately before animal sacrifice. (G–I) are the three orthogonal CBCT slices of tumor 1, with arrows pointing to the enhanced tumor edges. Comparison between (a)-(c) and (d)-(f) proves a good match between the CBCT contours and actual tumor volumes.
