
Figure 4. Ectopic expression of miR-1 and -133b suppressed the Warburg effect.
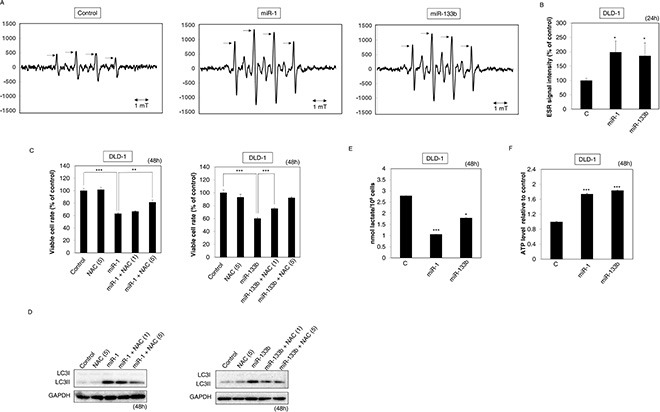
(A, B) Free radicals were evaluated by ESR at 24 h after the transfection of DLD-1 cells with miR-1 or -133b (20 nM). The representative ESR spectra are shown in “A” with the arrows indicating O2– (superoxide ion). The intensities of the spin adducts are shown in “B”. (C, D) Effects of NAC on the growth of DLD-1 cells after their transfection with miR-1 or -133b. DLD-1 cells were treated with NAC (1, 5 mM) at 24 h after the transfection with miR-1 or -133b (20 nM). (C) Cell viability of combination treatment with NAC and these miRs. (D) Western blot analysis at 48 h after the transfection of DLD-1 cells with NAC and these miRs. (E) Lactate production was measured at 48 h after the transfection of DLD-1 cells with miR-1 or -133b (20 nM). (F) ATP levels were measured under the same conditions as for lactate measurement. Results are presented as the mean ± SD; *P < 0.05; **P <0.01; ***P < 0.001.