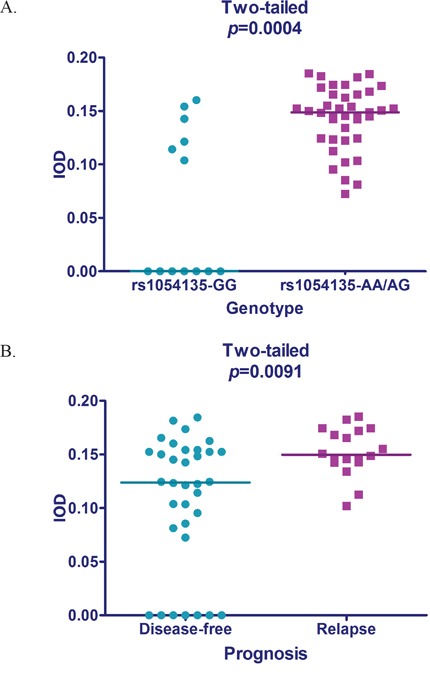
Figure 3. Scatterplot of FABP4 expression.

A. Intergroup difference of FABP4 expression in patients with different prognosis tested by the Mann-Whitney U test. B. Intergroup difference of FABP4 expression associated with different rs1054135 genotypes tested by the Mann-Whitney U test.
