
Figure 5. Effects of the normal diet and high fat diet on glomerular O2•− production in Asm+/+ and Asm−/− mice.
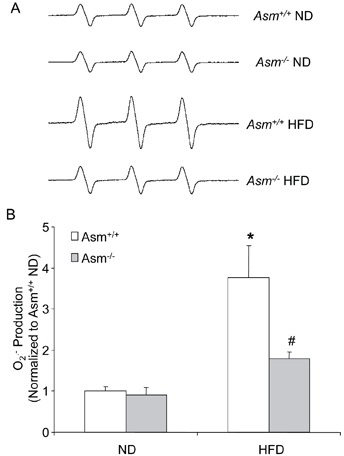
A. Representative ESR spectra traces for O2 •− production in Asm+/+ and Asm−/−mice. B. Values are arithmetic means ± SEM (n=5 each group) of O2 •− production in Asm+/+ and Asm−/− mice fed with normal diet or high fat diet. * Significant difference (P<0.05) compared to the values from Asm+/+ mice on the normal diet, # Significant difference (P<0.05) compared to the values from mice on the high fat diet. ND: Normal diet, HFD: High fat diet.