
Figure 3. The Kaplan-Meier curves of RFS for stage II CRC samples stratified by the 3-GPS in the training and validation datasets.
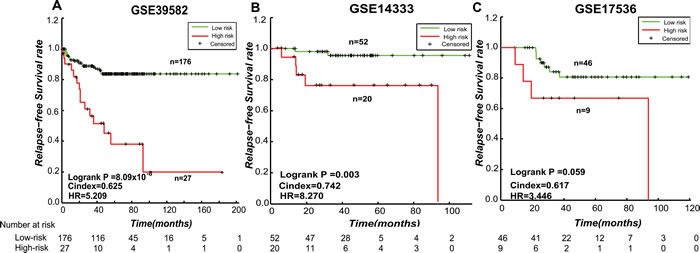
A. The training dataset GSE39582; B. The independent validation dataset GSE14333; C. The validation dataset GSE1736. A sample was classified into high-risk group (red line) only if at least two gene pairs in the 3-GPS voted for high-risk.