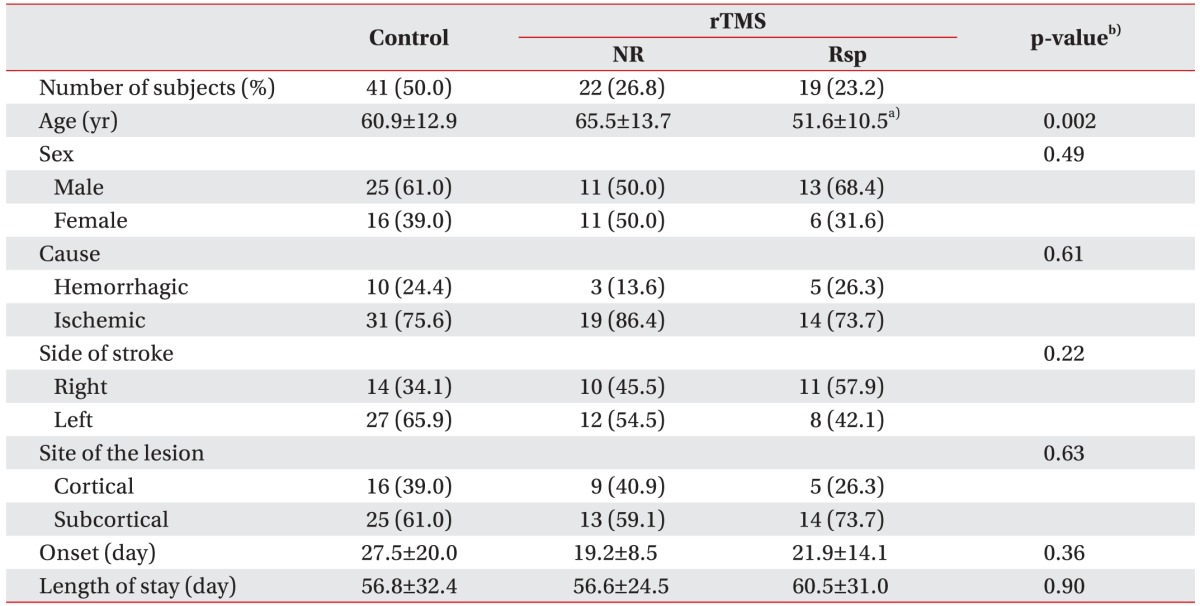
Table 1. Baseline characteristics of controls and rTMS-treated patients.

Values are presented as number (%) or mean±standard deviation.
rTMS, repetitive transcranial magnetic stimulation; NR, non-responding stroke patients; Rsp, responding stroke patients.
a)p<0.05 compared with control and NR, b)Kruskal-Wallis test with Bonferroni correction for continuous variables, or Pearson chi-square test for categorical variables.
