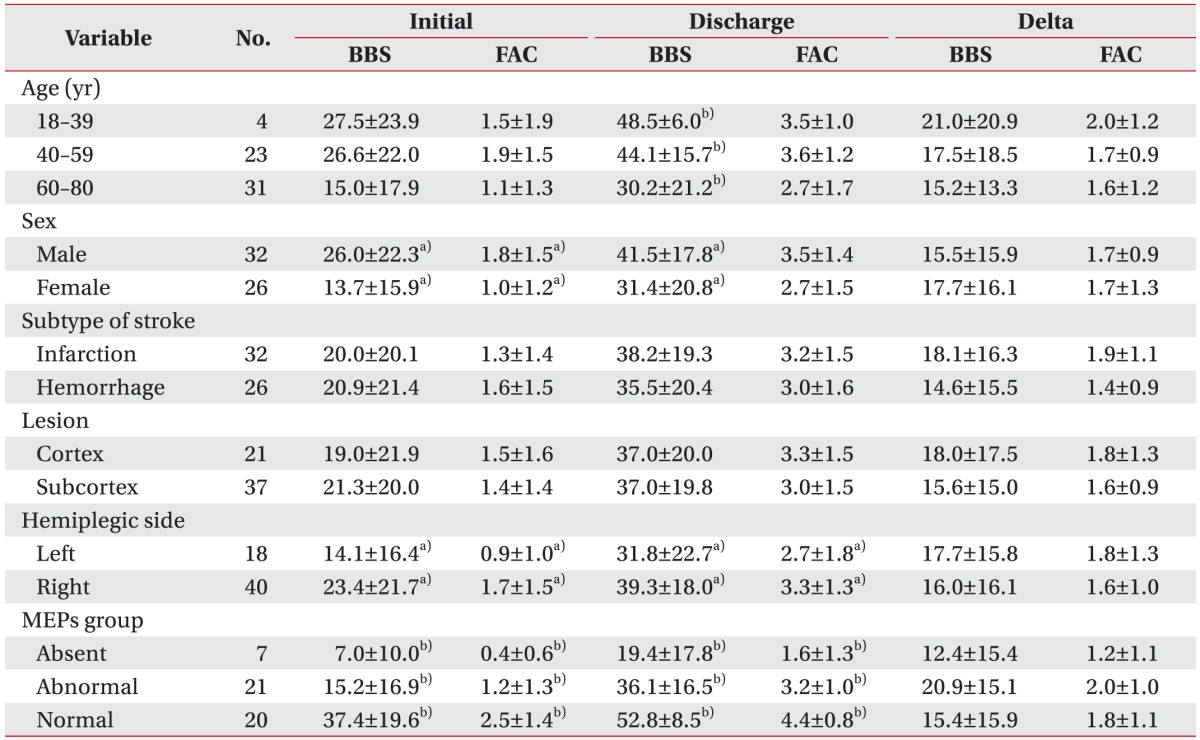
Table 2. BBS and FAC values at initial admission and at discharge, delta BBS, and delta FAC values of subjects (n=58).

Values are presented as mean±standard deviation.
MEPs, motor evoked potentials; BBS, Berg Balance Scale; FAC, Functional Ambulatory Category.
a)p<0.05 by independent t-test.
b)p<0.05 by one-way ANOVA test.
