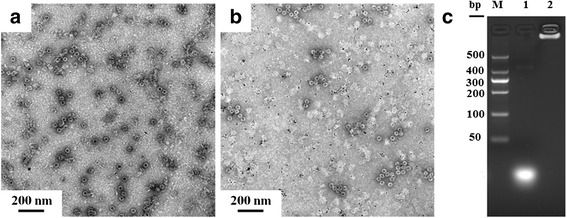
Fig. 3.

Characterization of CpG-Au@HBc VLPs and CpG@HBc VLPs. TEM images of negatively stained samples of HBc VLPs encapsulated a CpG-Au NPs and b Au NPs. c Agarose gel electrophore analysis of CpG ODN (20 bp) encapsulated into HBc (lane 2), lane 1: control experiment with free CpG at the same mass, lane M: marker
