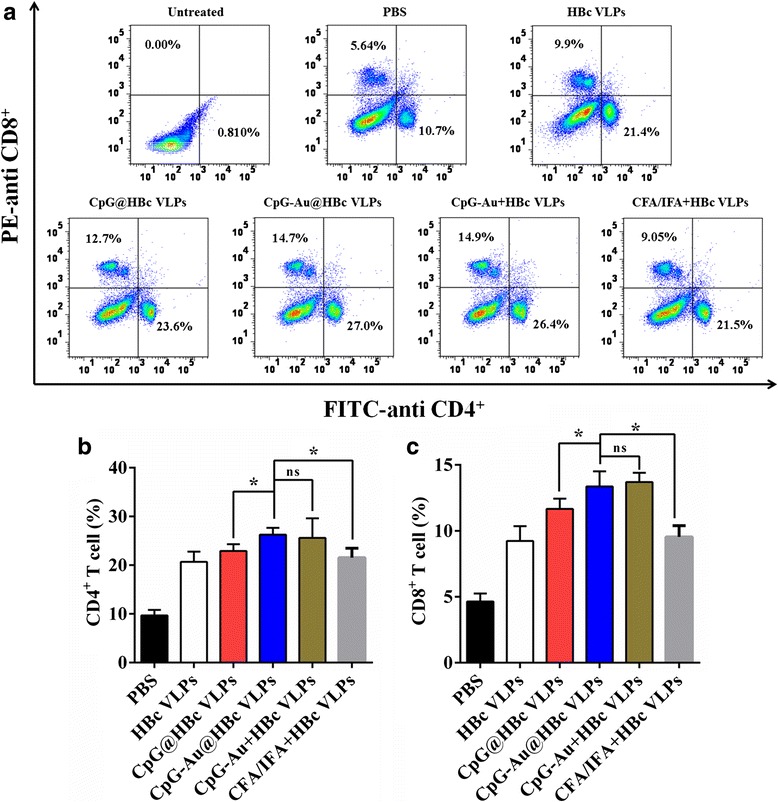
Fig. 5.

Induction of HBc-specific CD4+ and CD8+ T cells after immune with HBc VLPs, CpG@HBc VLPs, CpG-Au@HBc VLPs, CpG-Au + HBc VLPs, CFA/IFA + HBc VLPs, and PBS, respectively. The splenocyte surface molecules expressions were determined with flow cytometry analysis. A representative result of three independent experiments was shown in (a); the data shown in (b) and (c) were determined as means ± SD from three experiments. The statistical significance of the results was analyzed and indicated: *p < 0.05. ns no significant difference
