. 2016 Jun 30;14(2):46–52. doi: 10.5808/GI.2016.14.2.46

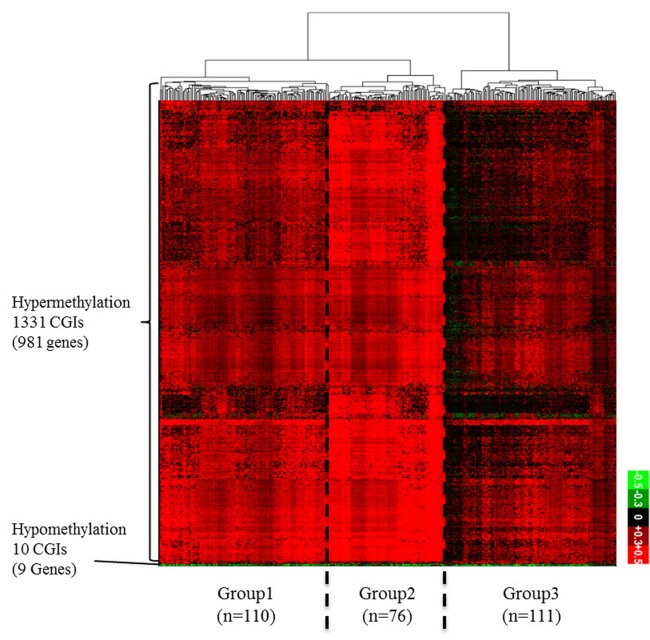
Fig. 2. (A) Differential DNA methylation pattern in promoter CpG islands (CGIs) between colon cancer (COAD) patients and normal. A distribution plot of mean beta-value between all tumor (red) and all normal (blue) samples. X-axis indicates beta-value ranging from 0 to 1. Y-axis indicates the density of accumulated beta-values. (B) Differential DNA methylation pattern in promoter CGIs between COAD patients and normal. A heatmap of clustered differentially methylated promoter CGIs. We defined promoter CGI that has ±0.3 differential beta-value in at least 30% patients as differentially methylated promoter CGIs. X-axis represents individual promoter CGIs (1,341 CGIs), and Y-axis represents each patient. (n = 297). Patients are divided based on hierarchical clustering using Euclidian distance similarity metric. Scale bar ranging from -0.5 to +0.5 tumor-normal beta-value.

Fig. 2