. 2016 Jun 30;14(2):46–52. doi: 10.5808/GI.2016.14.2.46

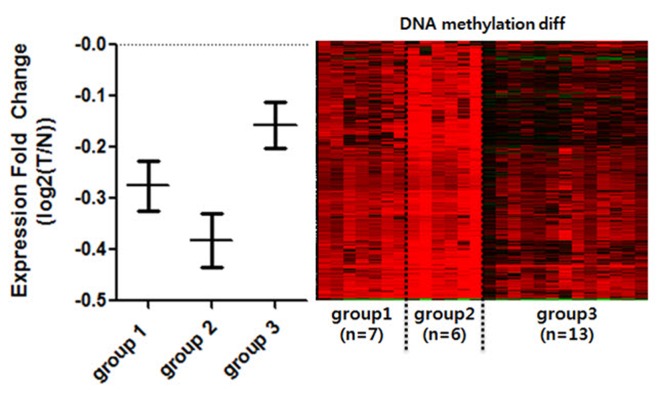
Fig. 3. Expression comparison among the groups of clustered hypermethylated promoter CpG islands (CGIs). Only the normal-tumor paired, and methylation-expression matched patients were selected for comparison of gene expression (n = 26). Patients were divided into the previously clustered groups by promoter CGI methylation. Expression fold change (Y-axis) was calculated by log2(T/N). Genes that overlap with hypermethylated promoter CGI were averaged by each patient and each group. Each bar represents standard error mean of each patient. Right panel is DNA methylation changing pattern of corresponding individual patients. T, tomor; N, normal.

Fig. 3