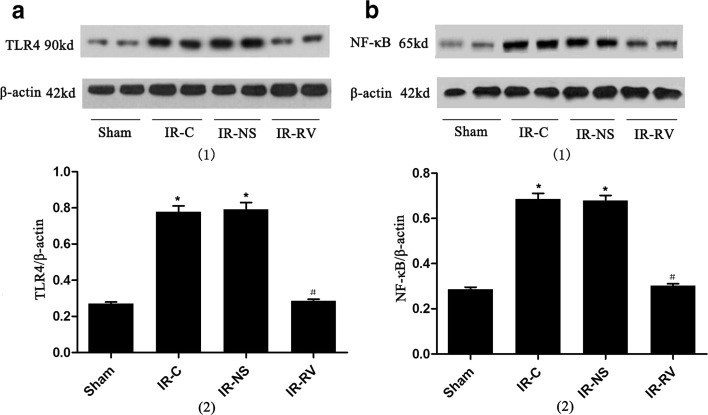
Fig. 9.
Western blot analysis of TLR4 and NF-κBp65 protein expression. Comparison of protein levels of TLR4 and NF-κBp65 of lung tissues from rats of different groups at T2. Samples were collected right after IR procedure was over and western blot was performed as described in “MATERIALS AND METHODS” section. β-Actin was used as a loading control. (1) Western blotting: a TLR4, b NF-κBp65. (2) Quantitative data of western blot: a TLR4, b NF-κBp65. Data were expressed as means ± SD and analyzed by ANOVA and unpaired-sample t test. n = 12 for each group. *P < 0.05 for comparisons of IR-C, IR-NS, and IR-RV groups with sham group; #P < 0.05 for comparisons of IR-NS and IR-RV groups with IR-C group.

