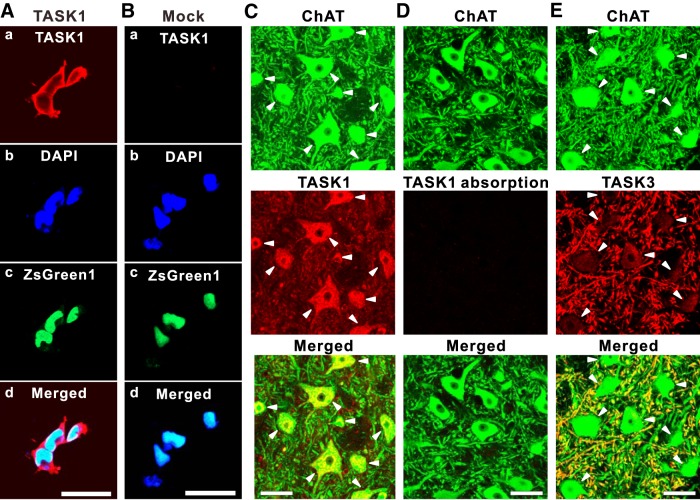
Figure 2.
Complementary distribution of TASK1 and TASK3 channels in MNs in the dl-TMN. Aa–Ad, HEK cells transfected with TASK1 and ZsGreen1 displaying immunoreactivity along the plasma membrane and partly in the cytoplasm (Aa); nuclei staining with DAPI (Ab); TASK1 transfection ensured with ZsGreen1 (Ac); and a merged fluorescence image (Ad). Ba–Bd, HEK cells transfected with mock and ZsGreen1 displaying no immunoreactivity (Ba); nuclei staining with DAPI (Bb); mock transfection ensured with ZsGreen1 (Bc); and a merged fluorescence image (Bd). C, Confocal photomicrographs showing immunoreactivity for ChAT (green) and TASK1 (red) in MNs. As revealed in the merged image, the TASK1 immunoreactivity was seen in somata (filled arrowheads) but not in dendrites. D, Confocal photomicrographs showing the elimination of TASK1 immunoreactivity in ChAT (green)-positive MNs following the absorption of anti-TASK1 antibody by preincubating with the antigen peptide of TASK1. E, Confocal photomicrographs showing immunoreactivity for ChAT (green) and TASK3 (red) in MNs. As revealed in the merged image, the TASK3 immunoreactivity was primarily seen in dendrites but not in somata (filled arrowheads). Scale bars: A–E, 50 μm.

