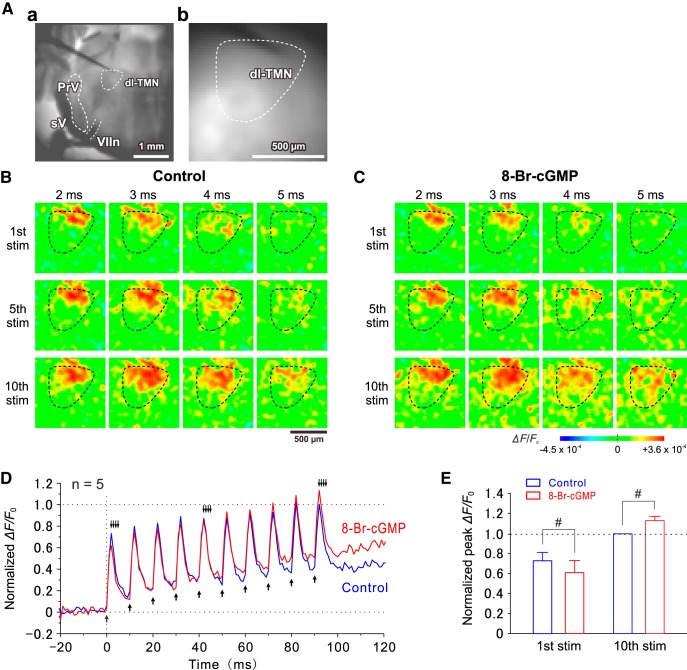
Figure 9.
Recruitment of MNs in the dl-TMN caused by the stimulation of presumed Ia afferents. Aa, A bright-field image of a brainstem slice including the dl-TMN. Ab, A resting light intensity image of the dl-TMN. B, C, Sample pseudocolor images of optical responses induced by stimulation of the dorsal part of the TMN before (B) and after (C) the application of 8-Br-cGMP. D, Traces representing averaged temporal profiles obtained before and after the application of 8-Br-cGMP (n = 5). Upward arrows indicate the time points at which the stimuli were applied. Downward arrows indicate the time points at which the respective pseudocolor images were obtained (B, C). E, The normalized peak amplitudes of optical responses induced by the 1st and 10th stimuli before and after the application of 8-Br-cGMP. #p < 0.02, two-way ANOVA followed by Fisher’s PLSD.

