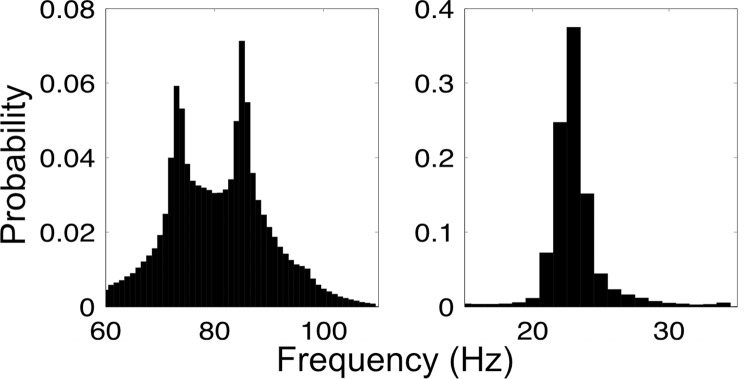
Figure 2.
Wave-packet frequency distributions. Gamma (left) and beta (right) wavepacket mean frequency histograms. Distributions represent bursts collected from OB and aPC. Gamma occupies a broad band with twin peaks at ∼73 Hz and ∼85 Hz in both the OB and aPC. Beta occupies a narrow band centered at ∼23 Hz.

