
Figure 3.
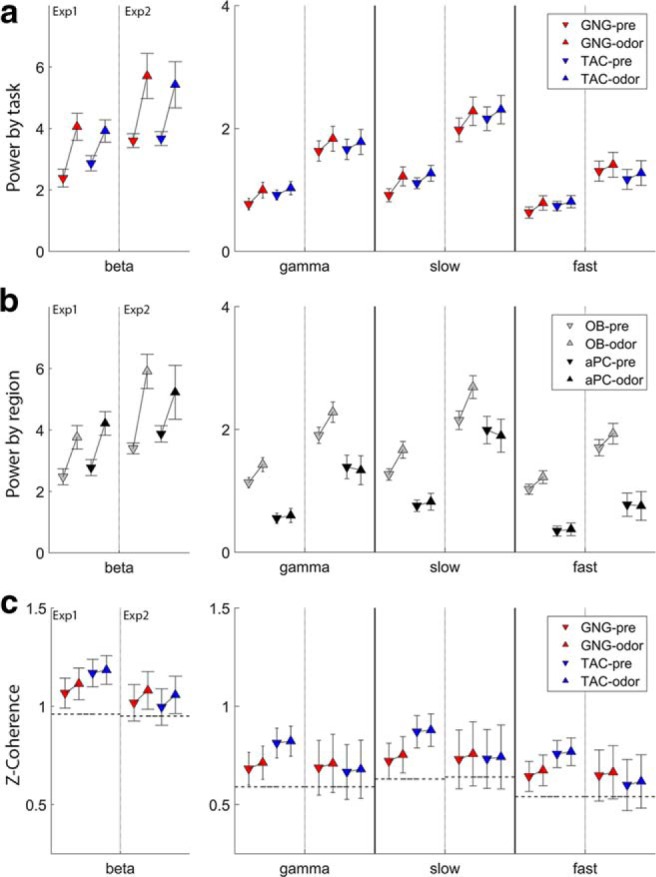
Summary of session statistics. Session statistics are computed on the entire odor or preodor period using GLS models across all factors listed in Tables 2–5. Results are displayed for preodor and odor periods for each band and experiment. Within each band, the left 2 pairs of markers are for Experiment 1, and the right for Experiment 2 for comparison. The scale for beta power is larger than for the gamma bands. a, Power comparisons by task for beta, gamma, slow gamma, and fast gamma. b, Power comparisons by brain region (OB and aPC). c, OB-aPC z-coherence (arctanh of coherence) values. Dashed horizontal lines indicate the values from shuffled trials for estimate of the random values.