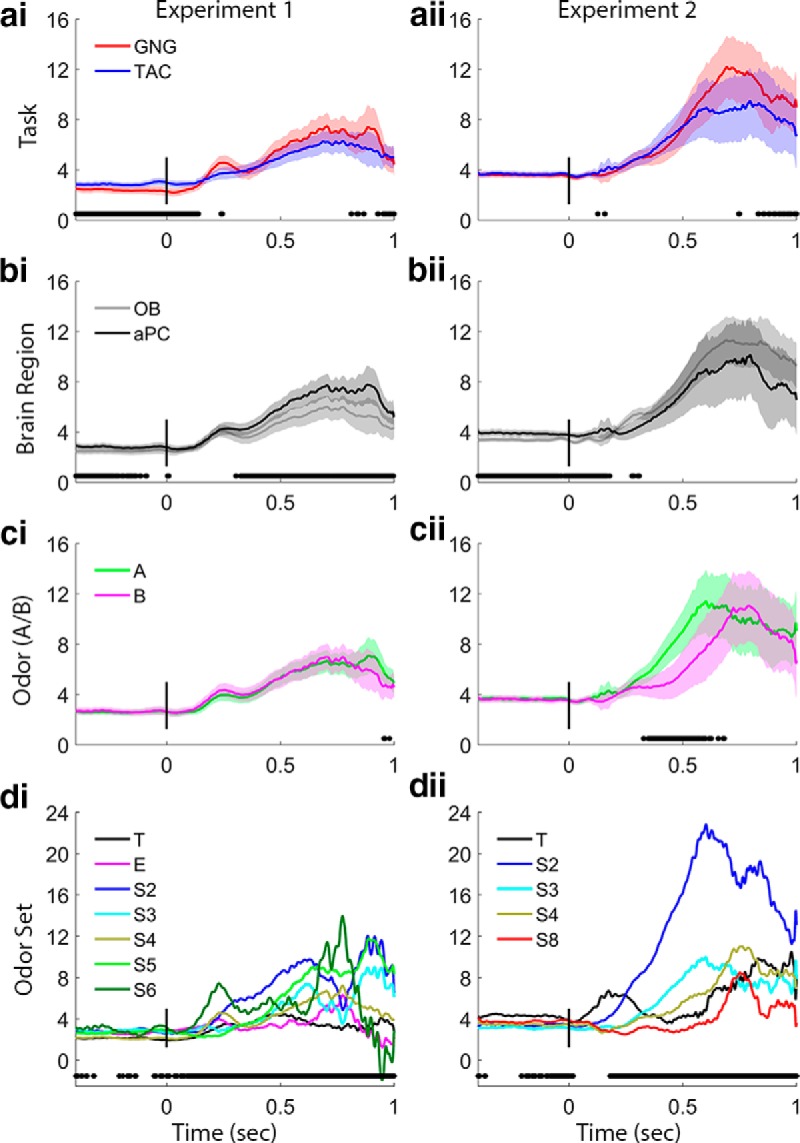
Figure 4.

Beta band trace power comparisons. Each row of plots shows a different main effects comparison for Experiments 1 and 2. These values are the outputs of the GLS analysis in which interaction terms were not significant, which means that the task plots in a include values from both OB and aPC, and the region plots in b include data from both GNG and TAC, etc. Black points below the plots indicate significance markers (p < 0.05) from GLS analysis on the time slice. We consider as significant only effects with a large number of consecutive significance markers. ai, aii, Task effects are significant before the nose-poke and in the early odor sampling period in Experiment 1, with TAC exhibiting stronger beta power. bi, bii, Brain region effects are significant in both experiments before nose-poke and in Experiment 1 during the period of strong beta during odor sampling, with stronger beta in the aPC. ci, cii, Odors (A or B) show no effects on beta power in Experiment 1, but beta increase starts earlier for odor A in Experiment 2 (left vs right in TAC, CS+ vs CS− in GNG, respectively). di, dii, Odor sets produced differences in beta power during the odor sampling period in both experiments and before the nose-poke in Experiment 2. The training odor set produced negligible beta in Experiment 1 and increased beta in Experiment 2. The extreme odor set produced very little beta. T, Training odor set; E, extreme odor set; S#, numbered odor sets (see Table 1). Power values are smoothed in time over a 50 point (∼25 ms) window.
