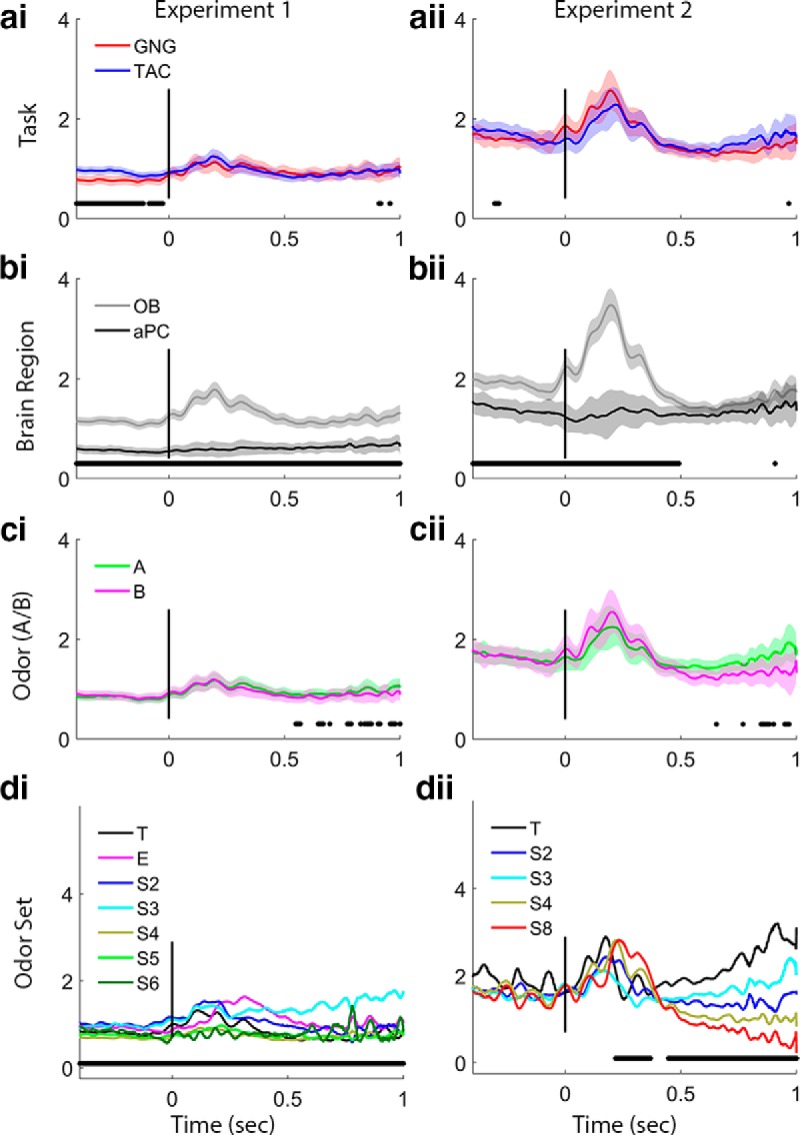
Figure 5.

Gamma band trace power comparisons. Plots arrayed as in Figure 4. ai, aii, Task effects are significant before the nose-poke in Experiment 1, with TAC exhibiting stronger gamma power. bi, bii, Brain region effects are significant in both experiments before nose-poke and during the initial odor sampling period and in Experiment 1 during the entire preodor and sampling period, with stronger gamma in the OB. ci, cii, Odors (A or B) show no significant differences in gamma in either experiment. di, dii, Odor sets produce differences in gamma power for both experiments during late odor sampling, and Experiment 1 shows a significant effect of odor set during the entire preodor and odor periods. Legends as in Figure 4d. Power values are smoothed in time over a 50 point (∼25 ms) window.
