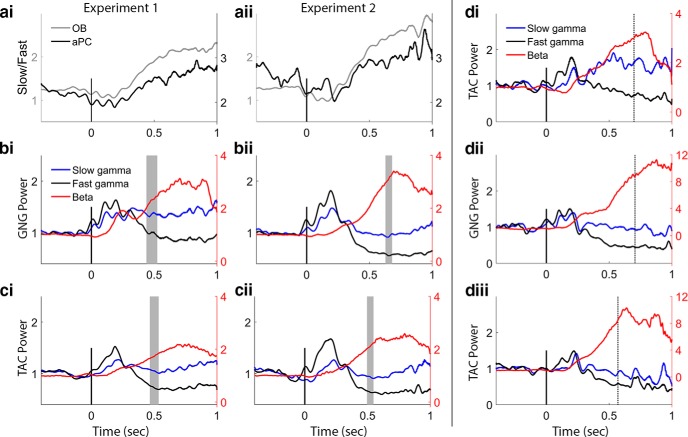
Figure 9.
Relative time courses of the frequency bands. a, Fast versus slow gamma dynamics in OB and aPC from Experiments 1 (ai) and 2 (aii); values from OB and aPC are plotted on different scales to emphasize the similarity in dynamics. The aPC has very little high-frequency gamma (compared with the OB, Figs. 5c, d, 6c, d), so the ratio of slow to fast gamma is very large in the PC. Both tasks show the same time course of change in slow/fast gamma ratio in the OB and aPC. In the OB, fast gamma power rises during early odor sampling producing a dip in the ratio from 0 to 250 ms, after which slow gamma increases steadily relative to fast gamma power during the rest of the sampling period. In the aPC, a decrease in the ratio (greater fast relative to slow gamma power) briefly during early odor sampling is followed by a return to baseline values. b, Comparison of beta, slow gamma, and fast gamma power traces from model estimates in the GNG task (values are normalized to prestimulus baseline values). Beta traces are displayed relative to the right vertical axis for ease of comparison. Left and right y-axes align at 1. Gray shaded vertical bars represent the distribution of end sampling times over all subjects and sessions. Note the opposing changes in power over time in fast gamma and beta. Fast gamma drops well below baseline levels after the initial 250 ms of odor sampling, whereas slow gamma returns to baseline after this early sampling period, increasing somewhat as sampling persists. Also note the easy identification of the first 3 gamma bursts associated with stereotyped sniffs. c, Comparison of beta, slow gamma, and fast gamma power traces from model estimates in the TAC task. The stereotyped gamma bursts/sniffs are not as clearly defined as in the GNG task. In Experiment 2 for both TAC and GNG (bii, cii), the sampling end time corresponds with the end of the rise in beta power. d, Example trace power plots from one rat that completed both experiments. Figure is from data using just S2 sessions. di, TAC power traces from Experiment 1 for odor sets S2, S3, and S4. dii, GNG power traces from Experiment 2 for odor sets S2, S3, and S4. diii, TAC power traces from Experiment 2 for the same odor sets. Note the difference in gamma bursts between TAC and GNG. Values are smoothed in time over a 50 point (∼25 ms) window.

