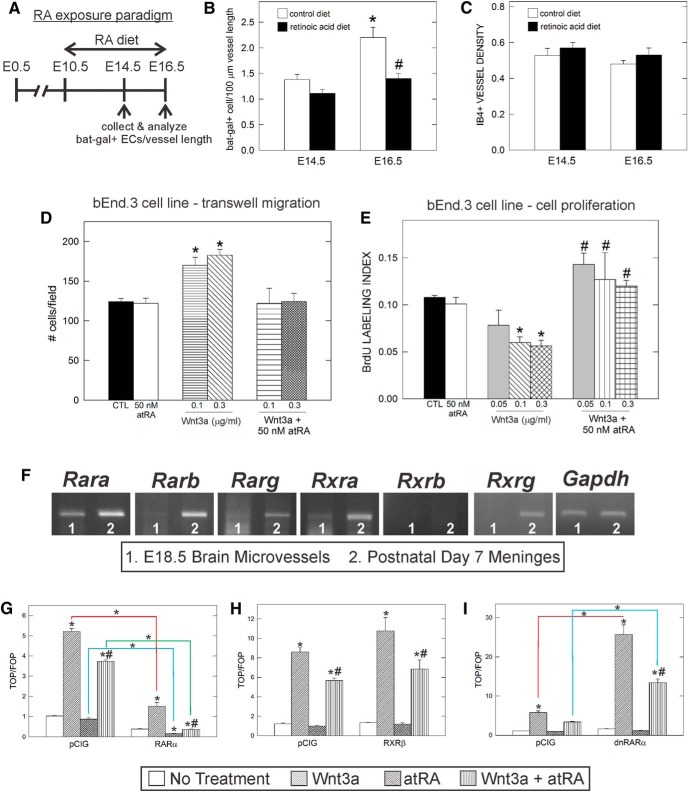
Figure 6.
RA inhibits endothelial WNT signaling in vivo and in vitro. A, Depiction of RA treatment paradigm for pregnant Bat-gal-LacZ/+ animals. B, Graph depicting quantification of β-gal+ ECs per 100 μm vessel length in control and RA-exposed fetuses at E14.5 and E16.5. *Significant difference from E14.5 control diet; #significant difference from control diet at E16.5. C, Graph depicting quantification of vessel density in control and RA-treated animals at E14.5 and E16.5. D, Graph depicting quantification of transwell migration assay with bEnd.3 cell line after treatment with RA, WNT3a, or RA + WNT3a. *Significance from untreated cells (CTL). E, Quantification of cell proliferation of bEnd.3 cells after 3 d of treatment with RA, WNT3a, or both. *Significance from untreated cells (CTL); #significant difference from WNT3a treatment. F, RT-PCR for RARs and RXRs using E18.5 microvessel and postnatal day 7 meninges cDNA. The housekeeping gene GAPDH is used to show equal amount of RNA to generate the cDNA used in the RT-PCR. G, Transfection of a RARα construct decreases the response of cells to WNT stimulation. Two-way ANOVA revealed a significant difference due to construct (F(1, 16) = 1301, p < 0.001) and treatment (F(3, 16) = 518.1, p < 0.001), as well as a significant interaction between both factors (F(3, 16) = 200.1, p < 0.001). H, RXRβ does not alter the response of cells to WNT stimulation. Two-way ANOVA revealed a significant difference due to treatment (F(3, 16) = 90.17, p < 0.001), but no significant difference due to construct (F(1, 16) = 4.358, p > 0.05) and no interaction between the two factors (F(3, 16) = 1.188, p > 0.05). I, dnRARα increases the response of cells to WNT stimulation. Two-way ANOVA revealed a significant difference due to construct (F(1, 16) = 110.7, p < 0.001) and treatment (F(3, 16) = 110.7, p < 0.001), as well as a significant interaction between the two factors (F(3, 16) = 49.98, p < 0.001). For G–I, asterisks directly above the bar indicate significance from untreated pCIG control and hash marks indicate significance from WNT3a treatment alone; within-group differences are indicated by connected lines.

