Figure 7.
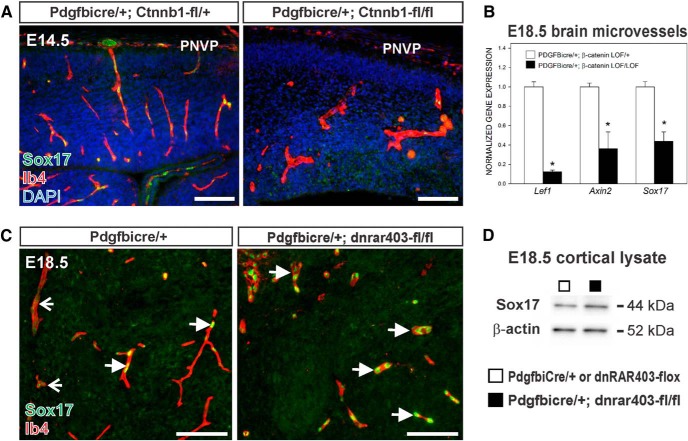
Elevated expression of Sox17 in PdgfbiCre;dnRAR403-fl/fl neurovasculature. A, Immunostaining for Sox17 (green) in Ib4+ (red) cerebral vessels in tissue from control and an EC-specific knock-down of WNT signaling component β-catenin at E14.5 (PdgfbiCre;Ctnnb1-fl/fl). B, Graph depicting Lef1, Axin2, and Sox17 transcript levels in microvessels isolated from E18.5 PdgfbiCre/+;Ctnnb1-fl/+ and PdgfbiCre/+;Ctnnb1-fl/fl brains. Asterisks indicate significance from PdgfbiCre;Ctnnb1-fl/+ value. C, Representative Sox17 (green) immunostaining in Ib4+ (red) cerebral vessels at E18.5 from PdgfbiCre/+ and PdgfbiCre;dnRAR403-fl/fl brains. Open arrows indicate weakly Sox17+ vessels; arrows indicate vessels with high Sox17 expression. D, Sox17 (44 kDa) and β-actin (52 kDa) immunoblots on protein lysate from E18.5 control (□: PdgfbiCre/+ or dnRAR403-flox) or mutant (■: PdgfbiCre;dnRAR403-fl/fl) neocortices. Scale bars, 100 μm.

