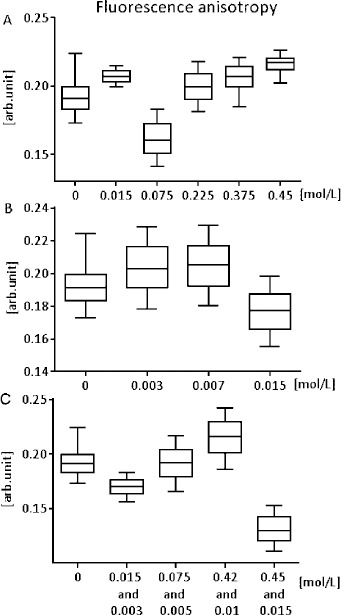
Figure 2.

Fluorescence anisotropy of DPH (reciprocal of the membrane fluidity) dependence on the concentration of captopril (A), nifedipine (B), and combination of captopril and nifedipine (C) in vitro. Reported concentrations correspond to the concentrations added to the incubation medium. 0 represents the control group. The minimum, lower quartile, median, upper quartile, and maximum of the measured value are presented; n = 7
