Figure 2.

Autophagy in LPS-induced lung injury
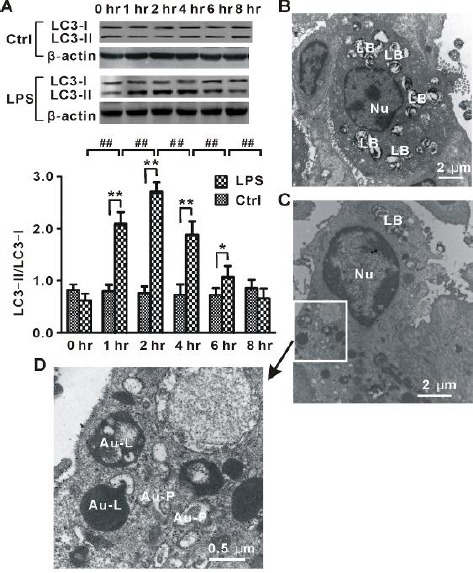
(A) Time-dependent changes in the protein level of LC3-II in lung tissues from rats (LPS, n=8 for each time point) injected with LPS and normal control animals (Ctrl, n=8 for each time point) treated with saline. (B) Representative electron microscopy images for normal alveolar type II cell. (C) Representative electron microscopy images for autophagic alveolar type II cells in LPS-2 hr group rats. (D) High-resolution figure of part of autophagic alveolar type II cell in (C) showed increased formation of autophagosomes. LB, lamellar bodies; Nu, nuclear; Au-P, autophagosome; Au-L, autolysosome. One-way ANOVA followed by a Student-Neuman-Keuls t-test was used to analyze significant differences in the protein level of LC3-II at each time point between control and LPS groups and between different time points in control and LPS groups. *P<0.05 and **P<0.01 indicates significant differences in the protein level of LC3-II at each time point between control and LPS groups. ##P < 0.01 indicates significant differences in the protein level of LC3-II between different time points in LPS groups
