Figure 3.

Apoptosis in LPS-induced lung injury
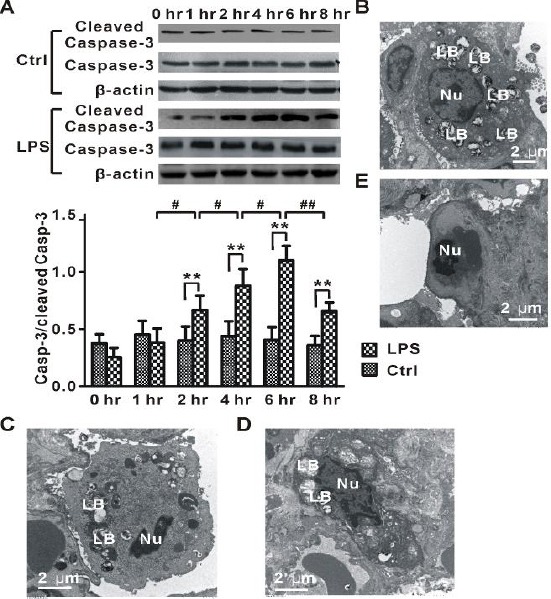
(A) Time-dependent changes in the protein level of cleaved caspase-3 in lung tissues from rats (LPS, n=8 for each time point) injected with LPS and normal control animals (Ctrl, n=8 for each time point) treated with saline. (B) Representative electron microscopy image for normal alveolar type II cell in Ctrl-6 hr group. (C) Representative electron microscopy image for apoptotic alveolar type II cell with chromatin condensed in the LPS-6 hr group. (D) Typical electron microscopy image for apoptotic alveolar type II cell with disruption of lamellar bodies, chromatin condensed at the periphery of the nucleus, and vacuolization of the nuclear membrane in the LPS-6 hr group. (E) Representative electron microscopy image for apoptotic endothelial cell with chromatin condensed in the LPS-6 hr group. LB, lamellar bodies; Nu, nuclear. One-way ANOVA followed by a Student-Neuman-Keuls t-test was used to analyze significant differences in the protein level of cleaved caspase-3 at each time point between control and LPS groups and between different time points in control and LPS groups. **P<0.01 indicates significant differences in the protein level of cleaved caspase-3 at each time point between control and LPS groups. #P<0.05 and ##P<0.01 indicate significant differences in the protein level of cleaved caspase-3 between different time points in LPS groups
