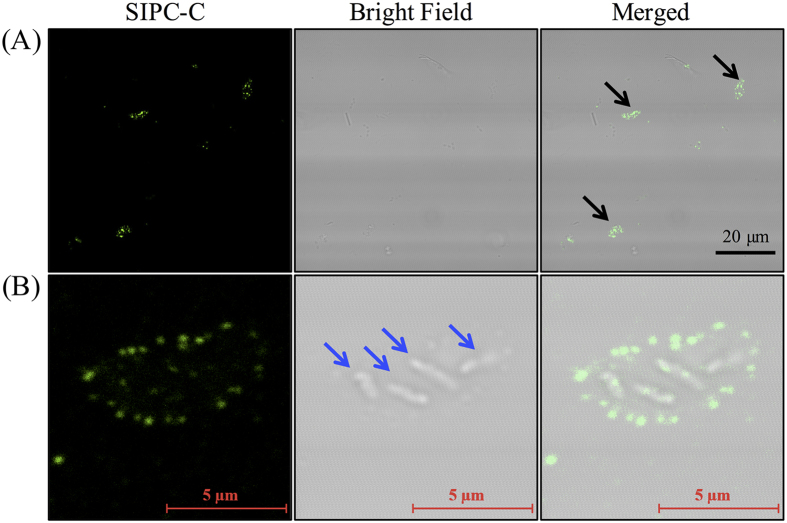
Figure 2. Fluorescent immunostaining for SIPC on cyprid-contacted surfaces.
(A) The black arrows indicate SIPC-immunoreactive signals in cyprid deposits. (B) A view of one cyprid deposit at high magnification. The blue arrows point to the rod-like structures that were considered to be bacteria. The immunostaining was repeated three times and one group of images were presented. The 3D view of a cyprid deposit was constructed using Z-stack analysis and processed in IMARIS (Supplementary Movie S1).

