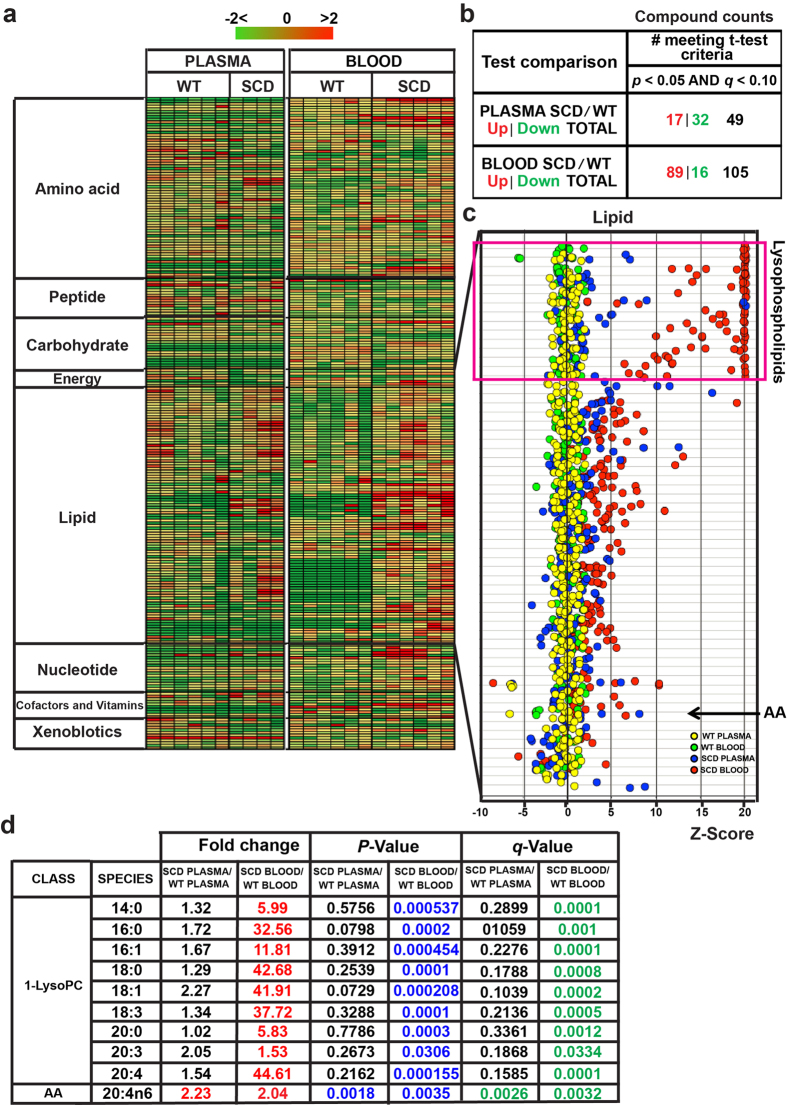
Figure 1. Metabolomic screening of mouse whole blood and plasma in WT and SCD mice.
(a) Heat map showing the alteration of metabolite concentration of 8 groups (including amino acids, carbohydeates, cofactors, TCA cycle, lipids, nucleosides and metabolites, peptides and xenobiotics) shades of green and red represent an increase and decrease in metabolite concentration respectively; relative to the median metabolite level (see color scale). (b) Summary of significant altered metabolites in SCD mice compared to WT mice. (c) Z-score quantification of lipids detected in whole blood and plasma of both WT and SCD Tg mice (n = 4–6). Among all lipids detected, lysophospholipids were the most significantly elevated in whole blood of SCD Tg mice compared with that in WT mice (n = 6). AA was elevated in both plasma and whole blood of SCD Tg mice (n = 4–6). (d) Profiling of Lysophospholipids and AA detected in whole blood and plasma of both control and SCD Tg mice (n = 4–6). q-value is a measure of false discovery rate.

