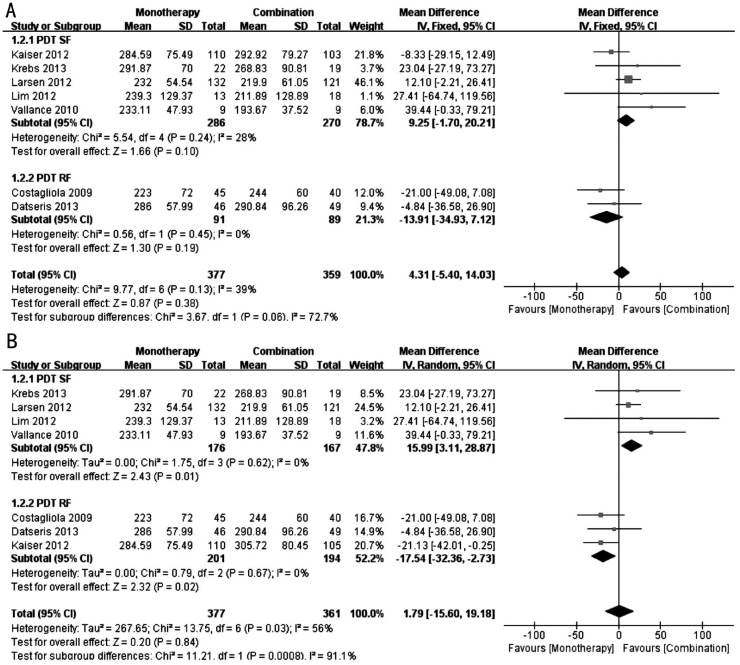
Figure 3. Forest plots of the effect on the CRT.
A: Comparison of CRT at 12th month between monotherapy group and combination group(including monotherapy group and PDT (SF) group of Kaiser et al's[17] study); B: Comparison of CRT at 12th month between monotherapy group and combination group [including monotherapy group and PDT (RF) group of Kaiser et al's[17] study].

