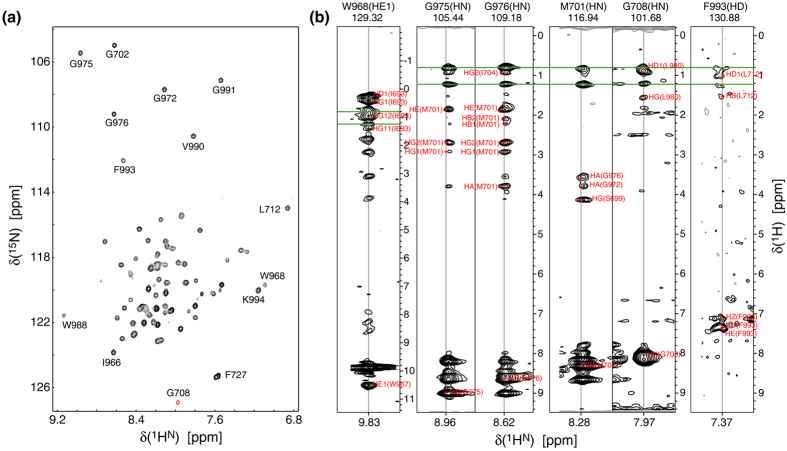
Figure 2. NMR spectra of the integrin αIIbβ3(A711P) TM complex.
(a) TROSY-type H-N correlation spectrum of disulfide-linked 2H/13C/15N-αIIb(A963C)–2H/13C/15N-β3(G690C/A711P). (b) 3D NOESY-TROSY strips of disulfide-linked 2H/15N-αIIb(A963C)–β3(G690C/A711P) and αIIb(A963C)–2H/15N-β3(G690C/A711P) illustrate interhelical NOEs. NOEs to protonated lipids are indicated by green lines. All spectra were recorded at 40 °C and 700 MHz.

