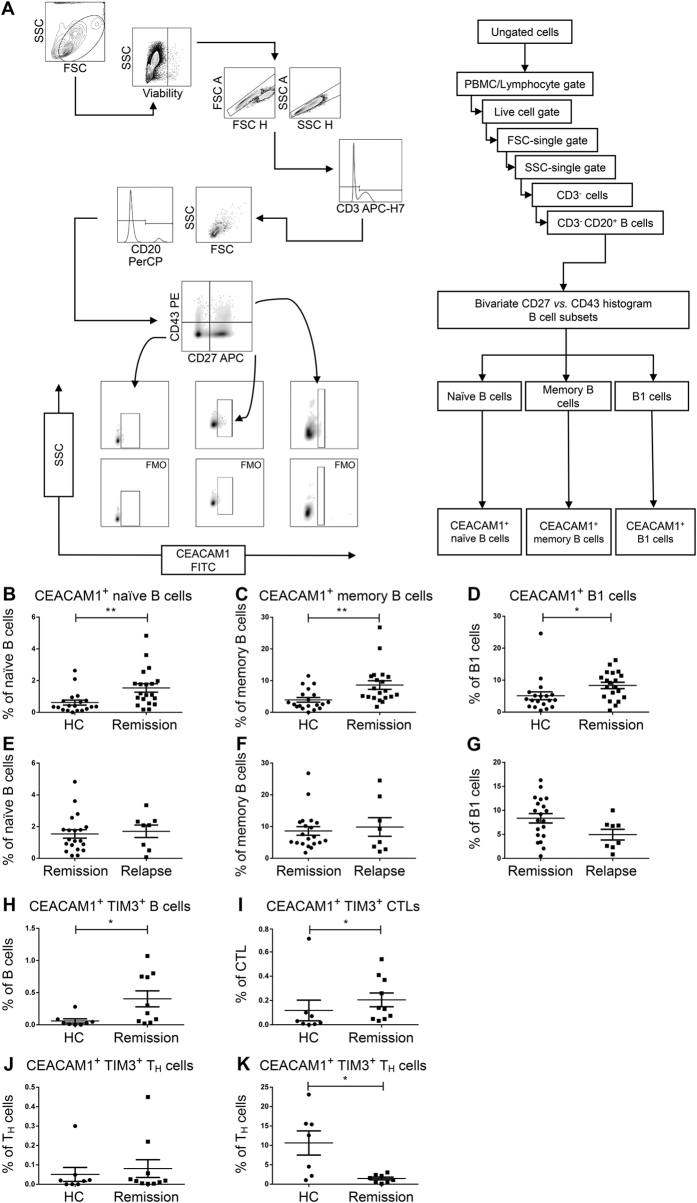
Figure 3. Flow cytometric analysis of CEACAM1 expression on peripheral B cells from healthy controls and RRMS patients.
(A) Gating strategy. (B–G) CEACAM1 expression on naïve (B,E) and memory B cells (C,F) as well as on B1 cells (D,G). MS patients were tested during remission (n = 19) (B–D) and relapse (n = 8) (E–G). Statistical significance was determined by Wilcoxon rank sum test. (H–K) CEACAM1/TIM-3 coexpression on B cells (H), cytotoxic T lymphocytes (CTLs, I) and T helper cells (TH, J,K) before (J) and after (K) anti-CD3/anti-CD28 antibody stimulation. Samples were analyzed from patients during remission that received treatment with natalizumab (before stimulation n = 10, after stimulation n = 8). Healthy controls (n = 8, n = 7) were age- and gender-matched. Patients in remission all received natalizumab (n = 19), while patients in relapse received either natalizumab (n = 1), interferon-β (n = 2) or were untreated (n = 5).

