
Figure 1. Changes in locomotion over time following temperature elevation.
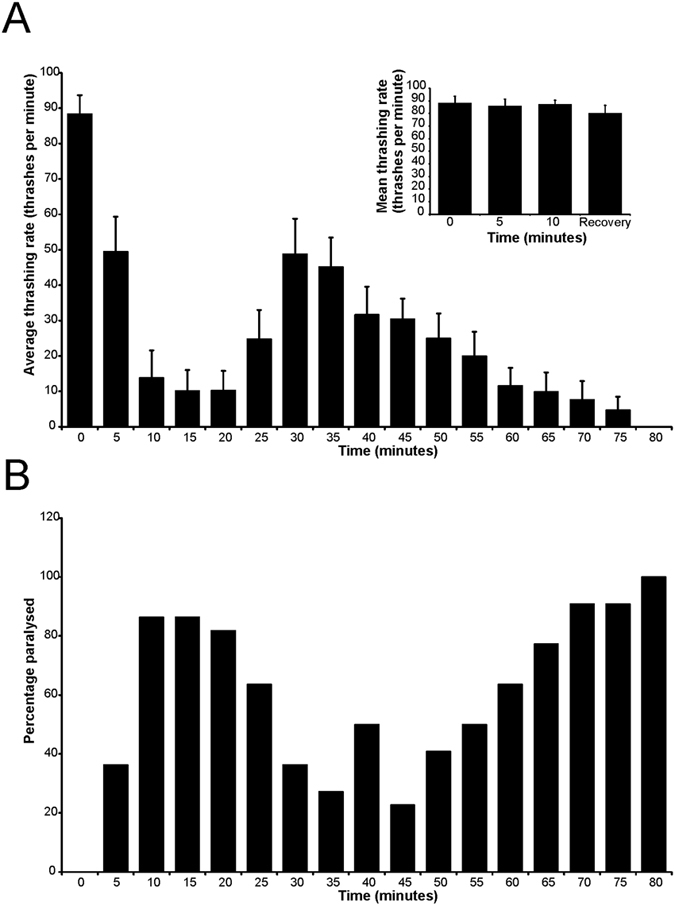
N2 worms were examined following elevation of temperature from 20 °C ± 0.5 to a final temperature of 28.0 °C ± 0.5. The rate of thrashing of individual worms was determined and the data shown as the mean rate of thrashing for the population ± SEM (A). The inset shows the rate of thrashing of those worms that were not paralysed, showing that they thrashed at the same rate before and during the time when other worms became paralysed and after the initial recovery period. The percentage of worm that were paralysed at each time point was also determined (B).