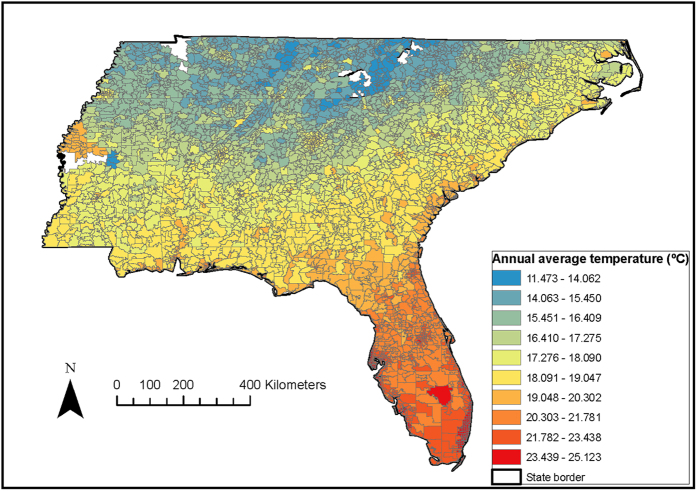
Figure 1. Spatial pattern of estimated temperature (°C), averaged over the 2011 for the Southeastern USA.
By using ArcGIS Desktop 10.3 (http://desktop.arcgis.com/en/arcmap/), each ZIP code centroid was linked to the nearest 1 km temperature grid, and then the 1 km daily temperature predictions were assigned to this ZIP code.

