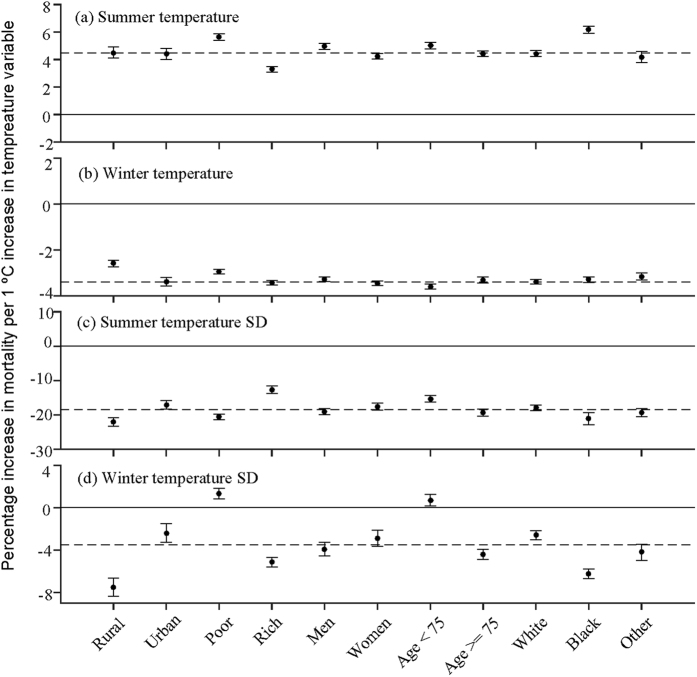
Figure 3. Modifications of the effect for spatial variability in different temperature indices by socio-economic and individual characteristics.
It displays the percent increases of death (95% CI) for each 1 °C increase in (a) spatial contrasts of summer mean temperature (b) spatial contrasts of winter mean temperature (c) spatial contrasts of summer temperature standard deviation (d) spatial contrasts of winter temperature standard deviation in each subgroup, respectively. Red indicates increased risk of death, and blue stands for decreased risk of death. Error bars stand for 95% confidence intervals.

