
Figure 7. The carriage of the fec locus in MPEC and phylogroup A E. coli.
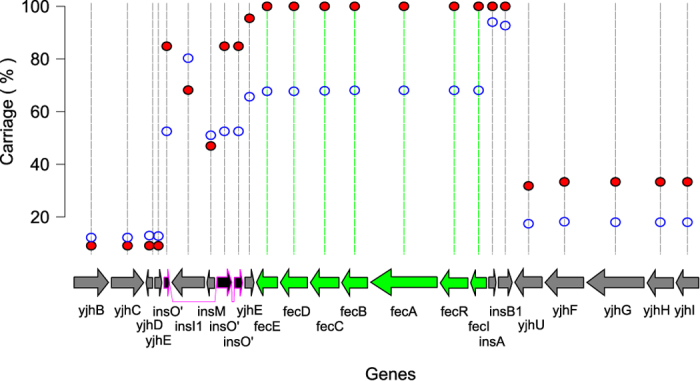
This plot shows the genomic context of the fecIRABCDE genes in the genome of MG1655 and the percent carriage of each gene in the phylogroup A population (blue open circles) versus the MPEC population (red closed circles). The seven genes which form part of the specific MPEC core genome are coloured green. These genes (fecIRABCDE) confer the ability for the bacteria to utilise ferric citrate as a source of iron for growth. These genes are found in only 68% of all phylogroup A genomes, but are found in all of the 66 MPEC genomes we investigated. The genes flanking the fec locus show differing levels of carriage, which tend to be lower than that observed for the fec locus itself. This suggests that the genomic context of fec is different in different strains.