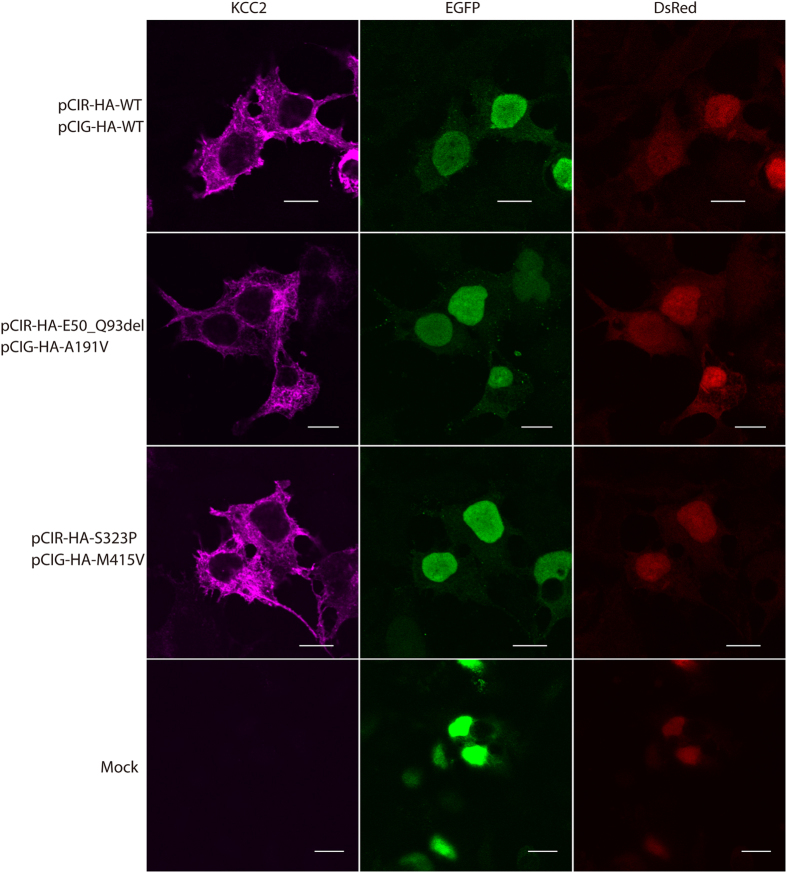
Figure 3. Cellular distribution of KCC2 mutants in transfected HEK293 cells.
Confocal immunofluorescence images of KCC2 in HEK293 cells co-expressing pCIR-HA-WT and pCIG-HA-WT (uppermost row), pCIR-HA-E50_Q93del and pCIG-HA-A191V (2nd row), pCIR-HA-S328P and pCIG-HA-M415V (3rd row), and only pCIG-HA and pCIR-HA (Mock; lowermost row). Cotransfection of HEK293 cells was confirmed by the presence of EGFP (green) and DsRed (red) in the nucleus. Similar expression patterns of KCC2 (pink) were observed in WT- and mutant-expressing cells. KCC2 immunofluorescence was not observed in mock-transfected cells. Scale bars represent 10 μm.

