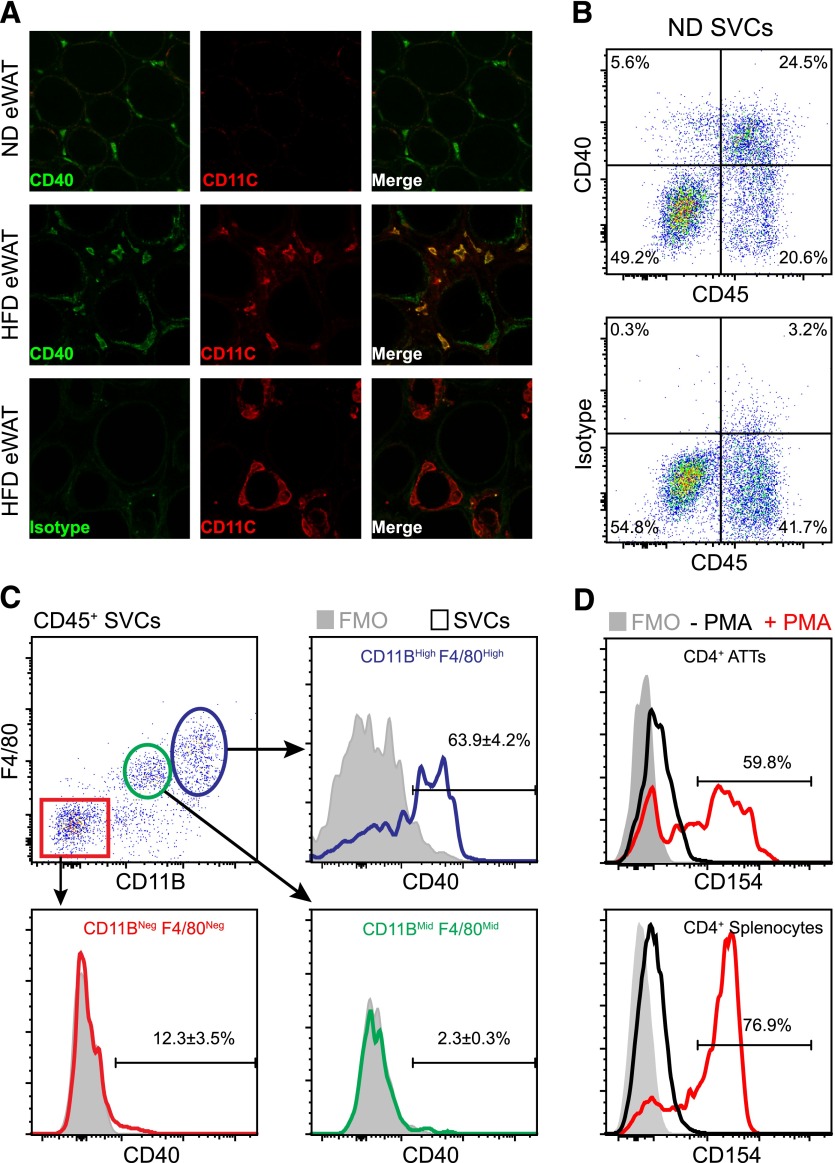
Figure 1. CD40/CD40L expression in visceral adipose tissue of mice.
Male C57BL/6 mice were fed ND or HFD for 20 wk to induce obesity. (A) Confocal microscopy images demonstrating CD40 (green) and CD11c (red) expression on ATMs in eWAT from lean (ND) and obese (HFD) mice. Staining with rat isotype (IgG2aκ) was used as a control. (B) Representative scatterplots demonstrating CD40 expression on adipose tissue leukocytes (CD45+) in eWAT from lean mice. (C) Surface expression of CD40 on ATMs (blue, CD45+CD11BhighF4/80High), CD11BMidF4/80Mid SVCs (green), and non-ATMs (red, CD45+CD11B−F4/80−) in eWAT from ND mice. Fluorescence minus one staining (FMO) (−CD40 mAb; shaded) is shown. (D) Histogram showing CD154 (CD40L) expression levels on unstimulated (− PMA; black) and stimulated (+ PMA; red) CD4+ ATTs isolated from eWAT of HFD-fed mice. Splenocytes were isolated and treated in parallel as a positive control (lower histogram). (B–D) The percentage (%; means ± sem) of cells in each gate is indicated.

