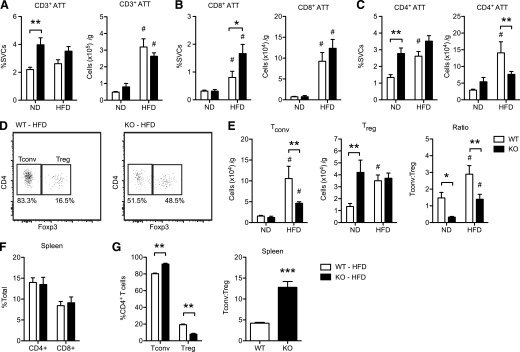
Figure 4. CD40 is required from maximal accumulation of CD4+ ATTs in response to diet-induced obesity.
WT and KO mice were fed ND and HFD, respectively, for 20 wk (n = 5–8 mice/group). ATTs were identified and quantified in eWAT by flow cytometry (see Supplement Fig. 1 for gating strategy). (A) Quantitation of CD3+ ATTs. Data are expressed as the percentage of total SVCs and total cells/gram of adipose (eWAT) tissue. (B–C) Quantitation of CD3+CD8+ ATTs, and CD3+CD4+ ATTs. (D) Representative flow plots demonstrating Tconv (Foxp3−) and Treg (Foxp3+) CD4+ ATTs in eWAT from WT and KO mice fed an HFD. Percentage of CD4+ ATTs in each gate is indicated. (E) Quantification of Tconv (CD3+CD4+Foxp3−) and Treg (CD3+CD4+Foxp3+) ATTs. Ratio of Tconv:Treg ATTs was also determined. (F) Quantification of CD4+ T cells and CD8+ T cells in spleens from HFD-fed mice. G: Quantification of Tconv and Treg cells, and ratio of Tconv:Treg in spleens from HFD-fed mice. Data are means ± sem. *P < 0.05, **P < 0.01, ***P < 0.001. #P < 0.05 vs. ND-fed mice.

