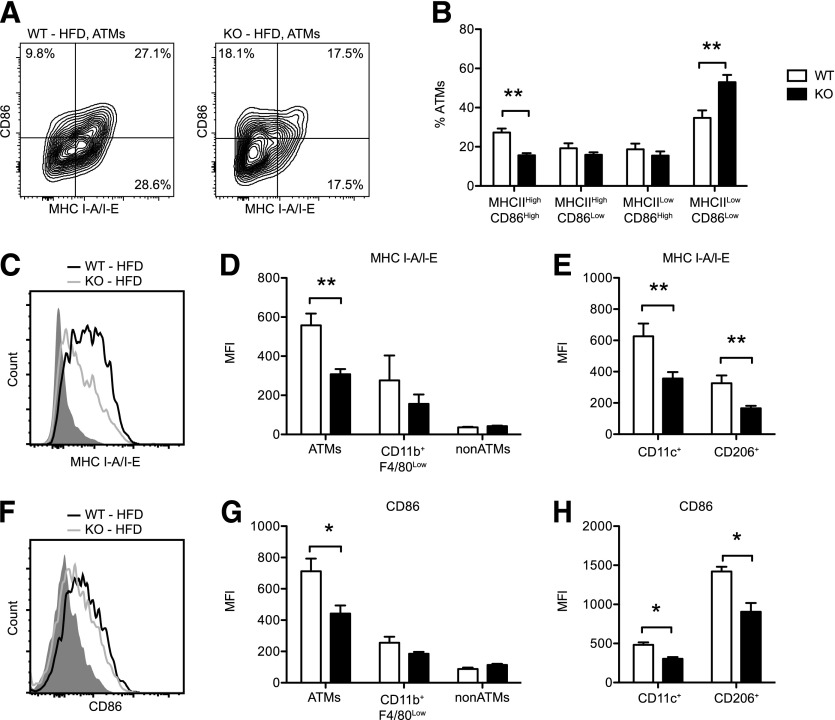
Figure 6. CD40 regulates MHC class II expression on ATMs during HFD-induced obesity.
WT and KO mice were fed HFD for 20 wk. ATMs were analyzed by flow cytometry (see Supplement Fig. 2 for gating strategy). (A) Representative contour plots showing CD86 and MHC II (MHC I-A/I-E) expression on ATMs from WT and KO mice. The percentage (%) of cells in each gate is indicated. (B) Distribution (% of ATMs) of MHC IIHigh CD86High, MHC IIHigh CD86Low, MHC IILow CD86High, and MHC IILow CD86Low ATMs in eWAT from WT and KO mice fed HFD (n = 5–8 mice/group). (C) Representative histograms showing surface expression of MHC II (I-A/I-E) on ATMs from WT (black line) and KO (gray line) mice fed an HFD. Isotype staining is indicated in the shaded histogram. (D) MHC I-A/I-E expression (mean fluorescence intensity [MFI]) on ATMs, CD11BHighF4/80High ATMs, CD11B+F4/80Low SVCs, and Non-ATMs (CD11B−F4/80−) after HFD exposure (n = 5–8 mice/group). E. Surface expression (MFI) of MHC I-A/I-E on CD11c+ (M1-like) and CD206+ (M2-like) ATMs from WT and KO mice after HFD (n = 5–8 mice/group). (F) Representative histograms showing surface expression of CD86 on ATMs from WT (black line) and KO (gray line) mice fed an HFD. Isotype staining is indicated in the shaded histogram. (G) CD86 expression (MFI) on ATMs, CD11BHighF4/80High ATMs, CD11B+F4/80Low SVCs, and non-ATMs (CD11B−F4/80−) after HFD exposure (n = 5–8 mice/group). (H) Surface expression (MFI) of CD86 on CD11c+ (M1-like) and CD206+ (M2-like) ATMs from WT and KO mice after HFD (n = 5–8 mice/group). Data are means ± sem. *P < 0.05, **P < 0.01.

