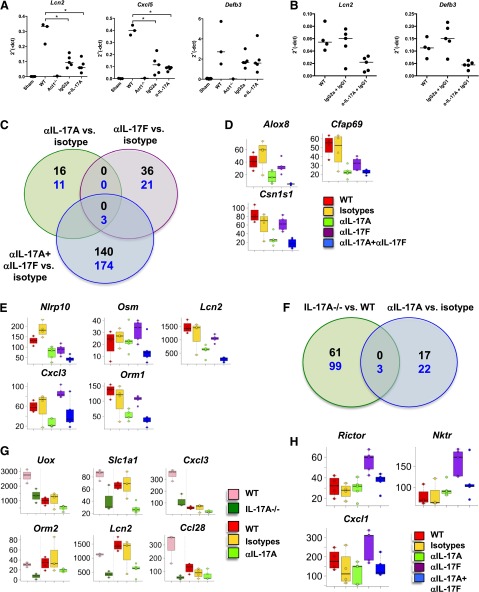
Figure 6. Gene-expression changes associated with OPC susceptibility.
(A and B) WT mice were treated with different doses of IgG2a or IgG1 or anti-IL-17A antibodies, and gene expression was assessed by qPCR. Expression was normalized to Gapdh. *P < 0.05 by ANOVA and post hoc Tukey’s test. All experiments were performed at least twice. (C and F) Venn diagrams of significant genes for anti-IL-17A, anti-IL-17F or anti-IL-17A + anti-IL-17F versus isotype control-treated mice. Thresholds used were fold change ≥ |2|, and P ≤ 0.05. Black numbers indicate up-regulated genes, and blue numbers indicate down-regulated genes. (D, E, G, and H) Box plots for selected genes showing the median, lower, and upper quartiles for the group-expression level. Individual dots show the MAS5-normalized linear intensity for individual animals.

